Urenui & Mimitangiatua Mauri Compass Survey
Te Runanga o Ngāti Mutunga
Data collection complete
8 of 8 Biospheres processed – 0 Biospheres still to come | 139 tuna measured | 6 native species found
How to Use This Site
Interactive Biospheres Map
Click any marker to view site details including water quality, species, and tuna counts
Water Quality Tab
View pH, temperature, and water clarity readings from all 8 Biospheres
Tuna Data Tab
Individual tuna measurements – length, weight, and size class for each tuna caught
Species Summary Tab
All native fish and invertebrates found at each site
Field Calculator
Estimate weight from length (or vice versa) – handy backup when batteries fail
Site Photo Gallery
Field photos from each site with extra species notes
Biospheres Viewer
Explore all 8 Biospheres with immersive panoramas, sci-fi scan animation & 2020 vs 2026 comparison
Our Survey Team
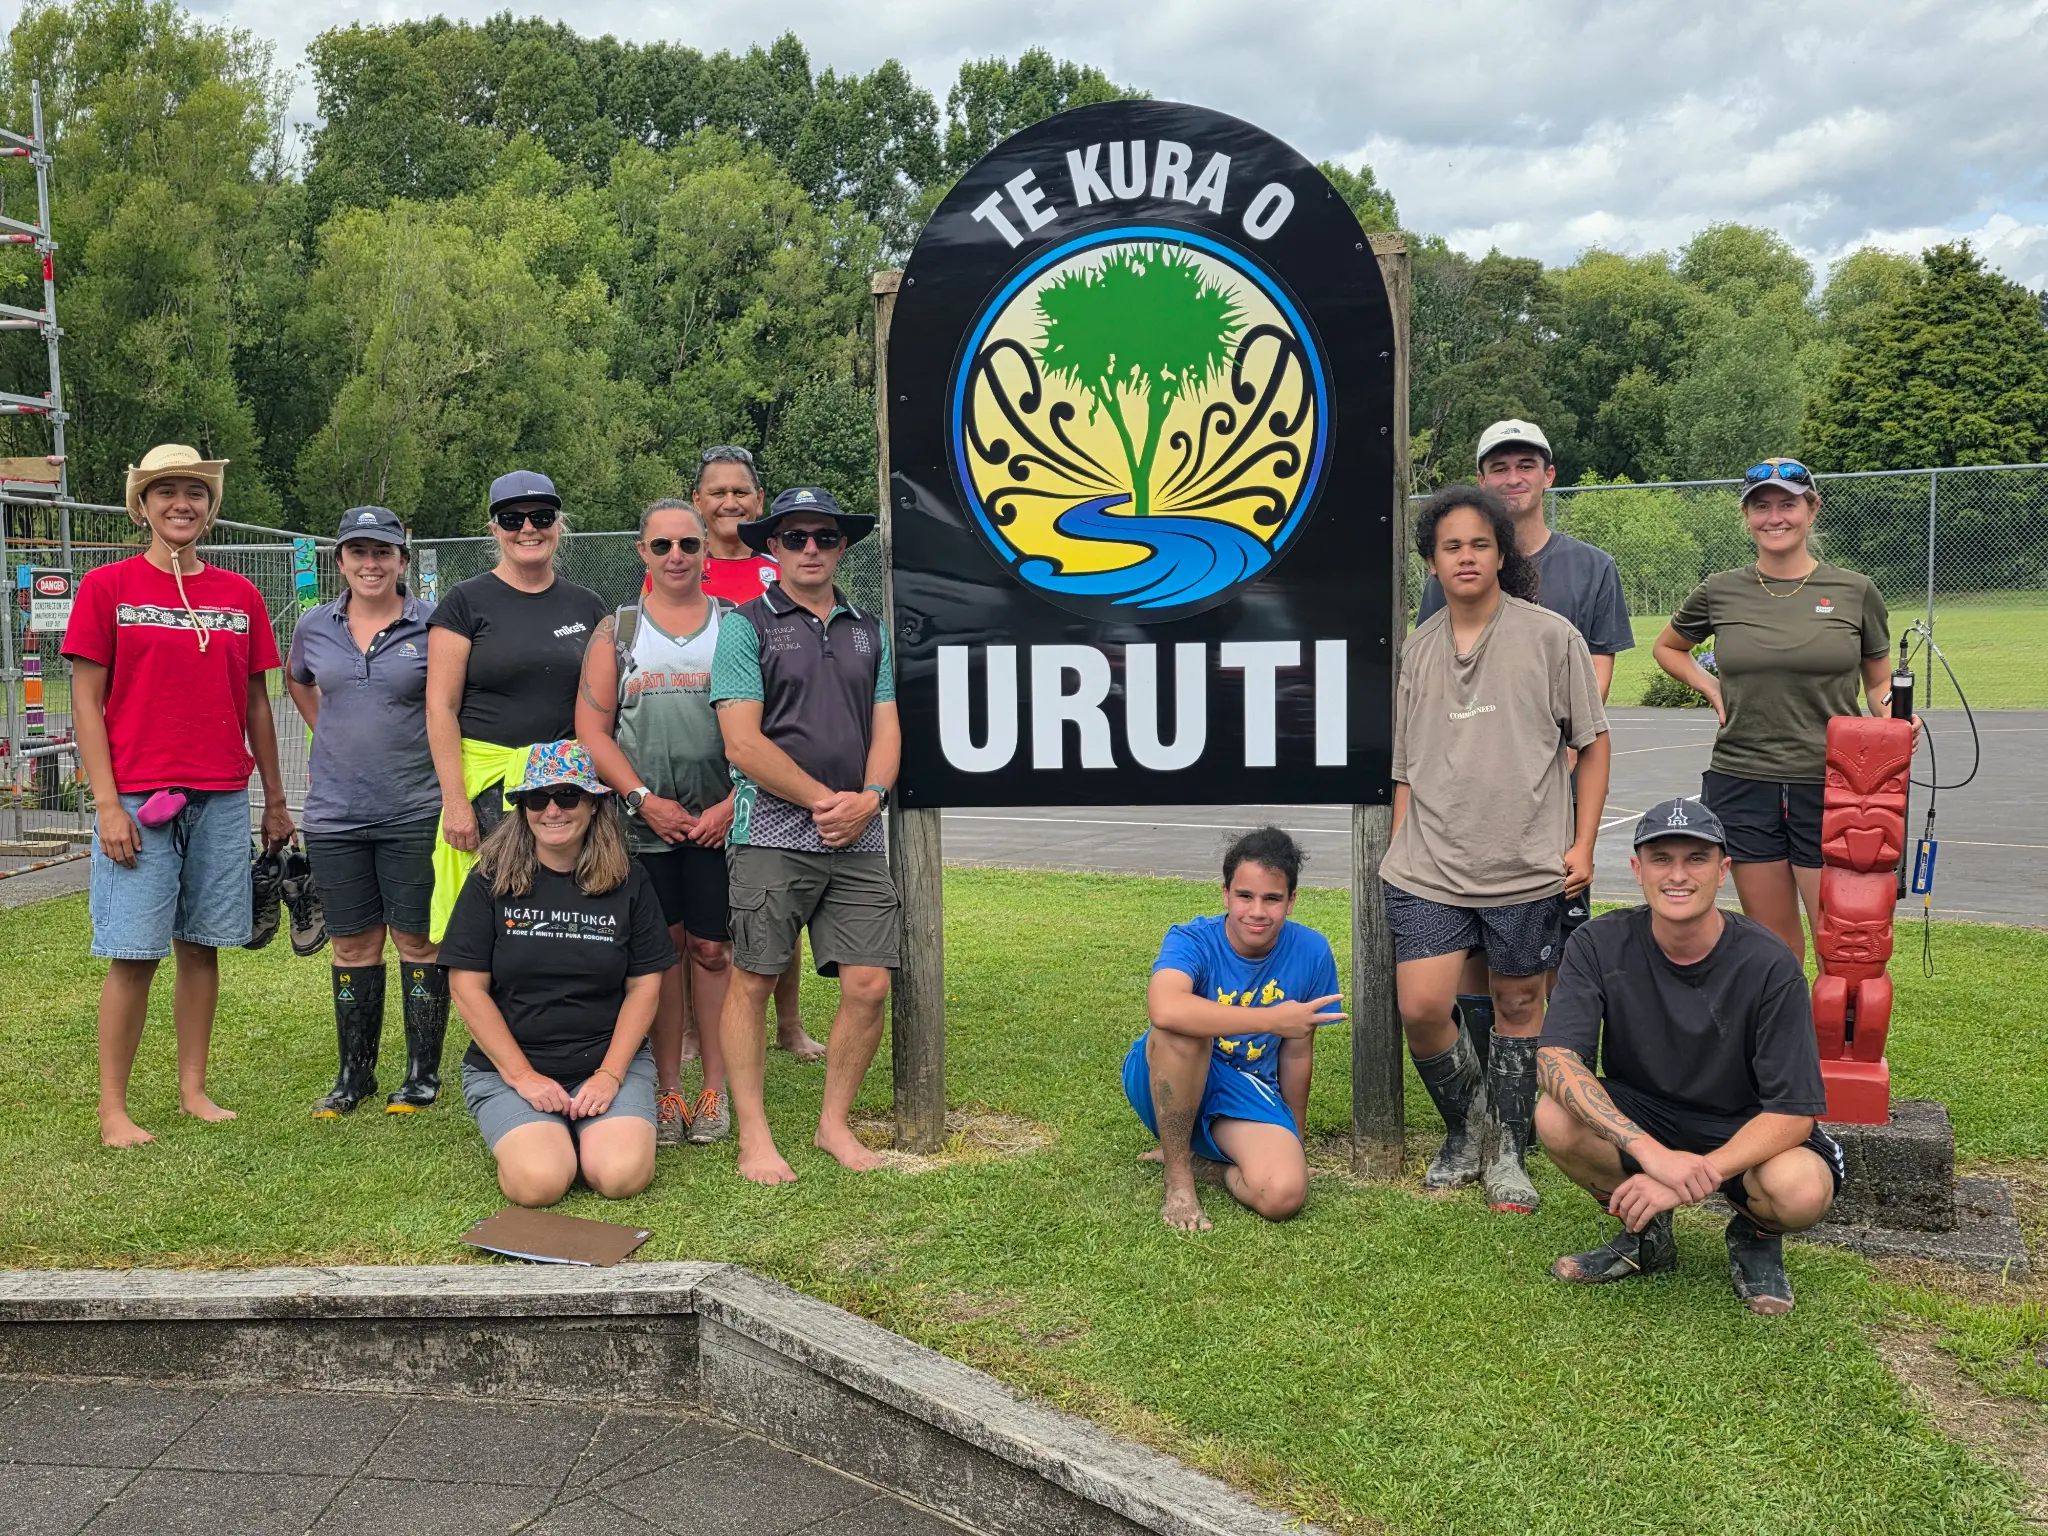
Te Kura o Uruti
Site 3 – Uruti Stream
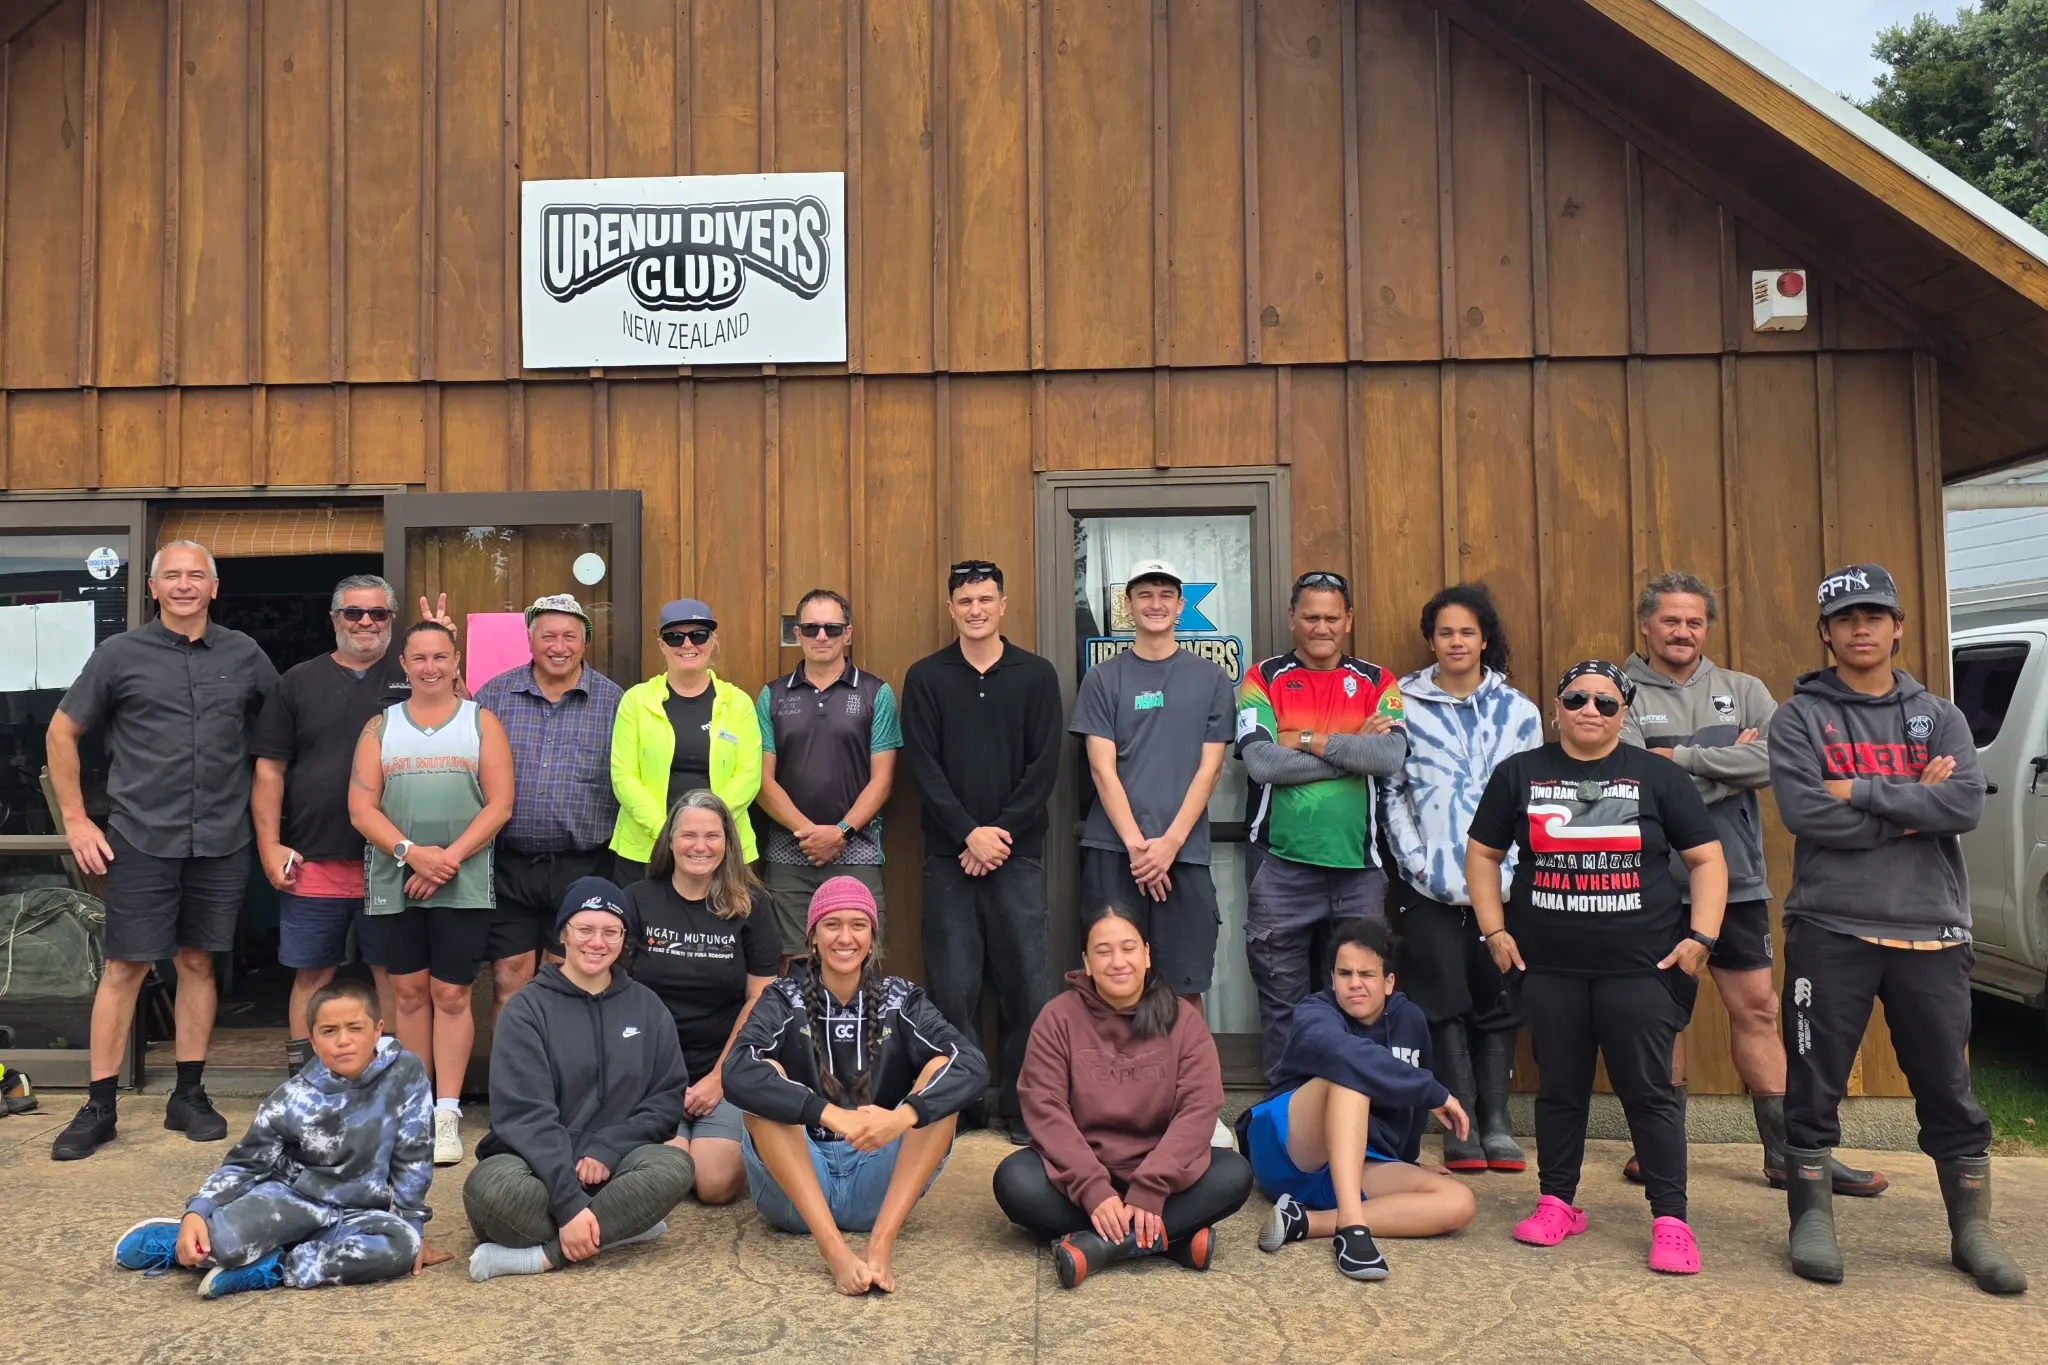
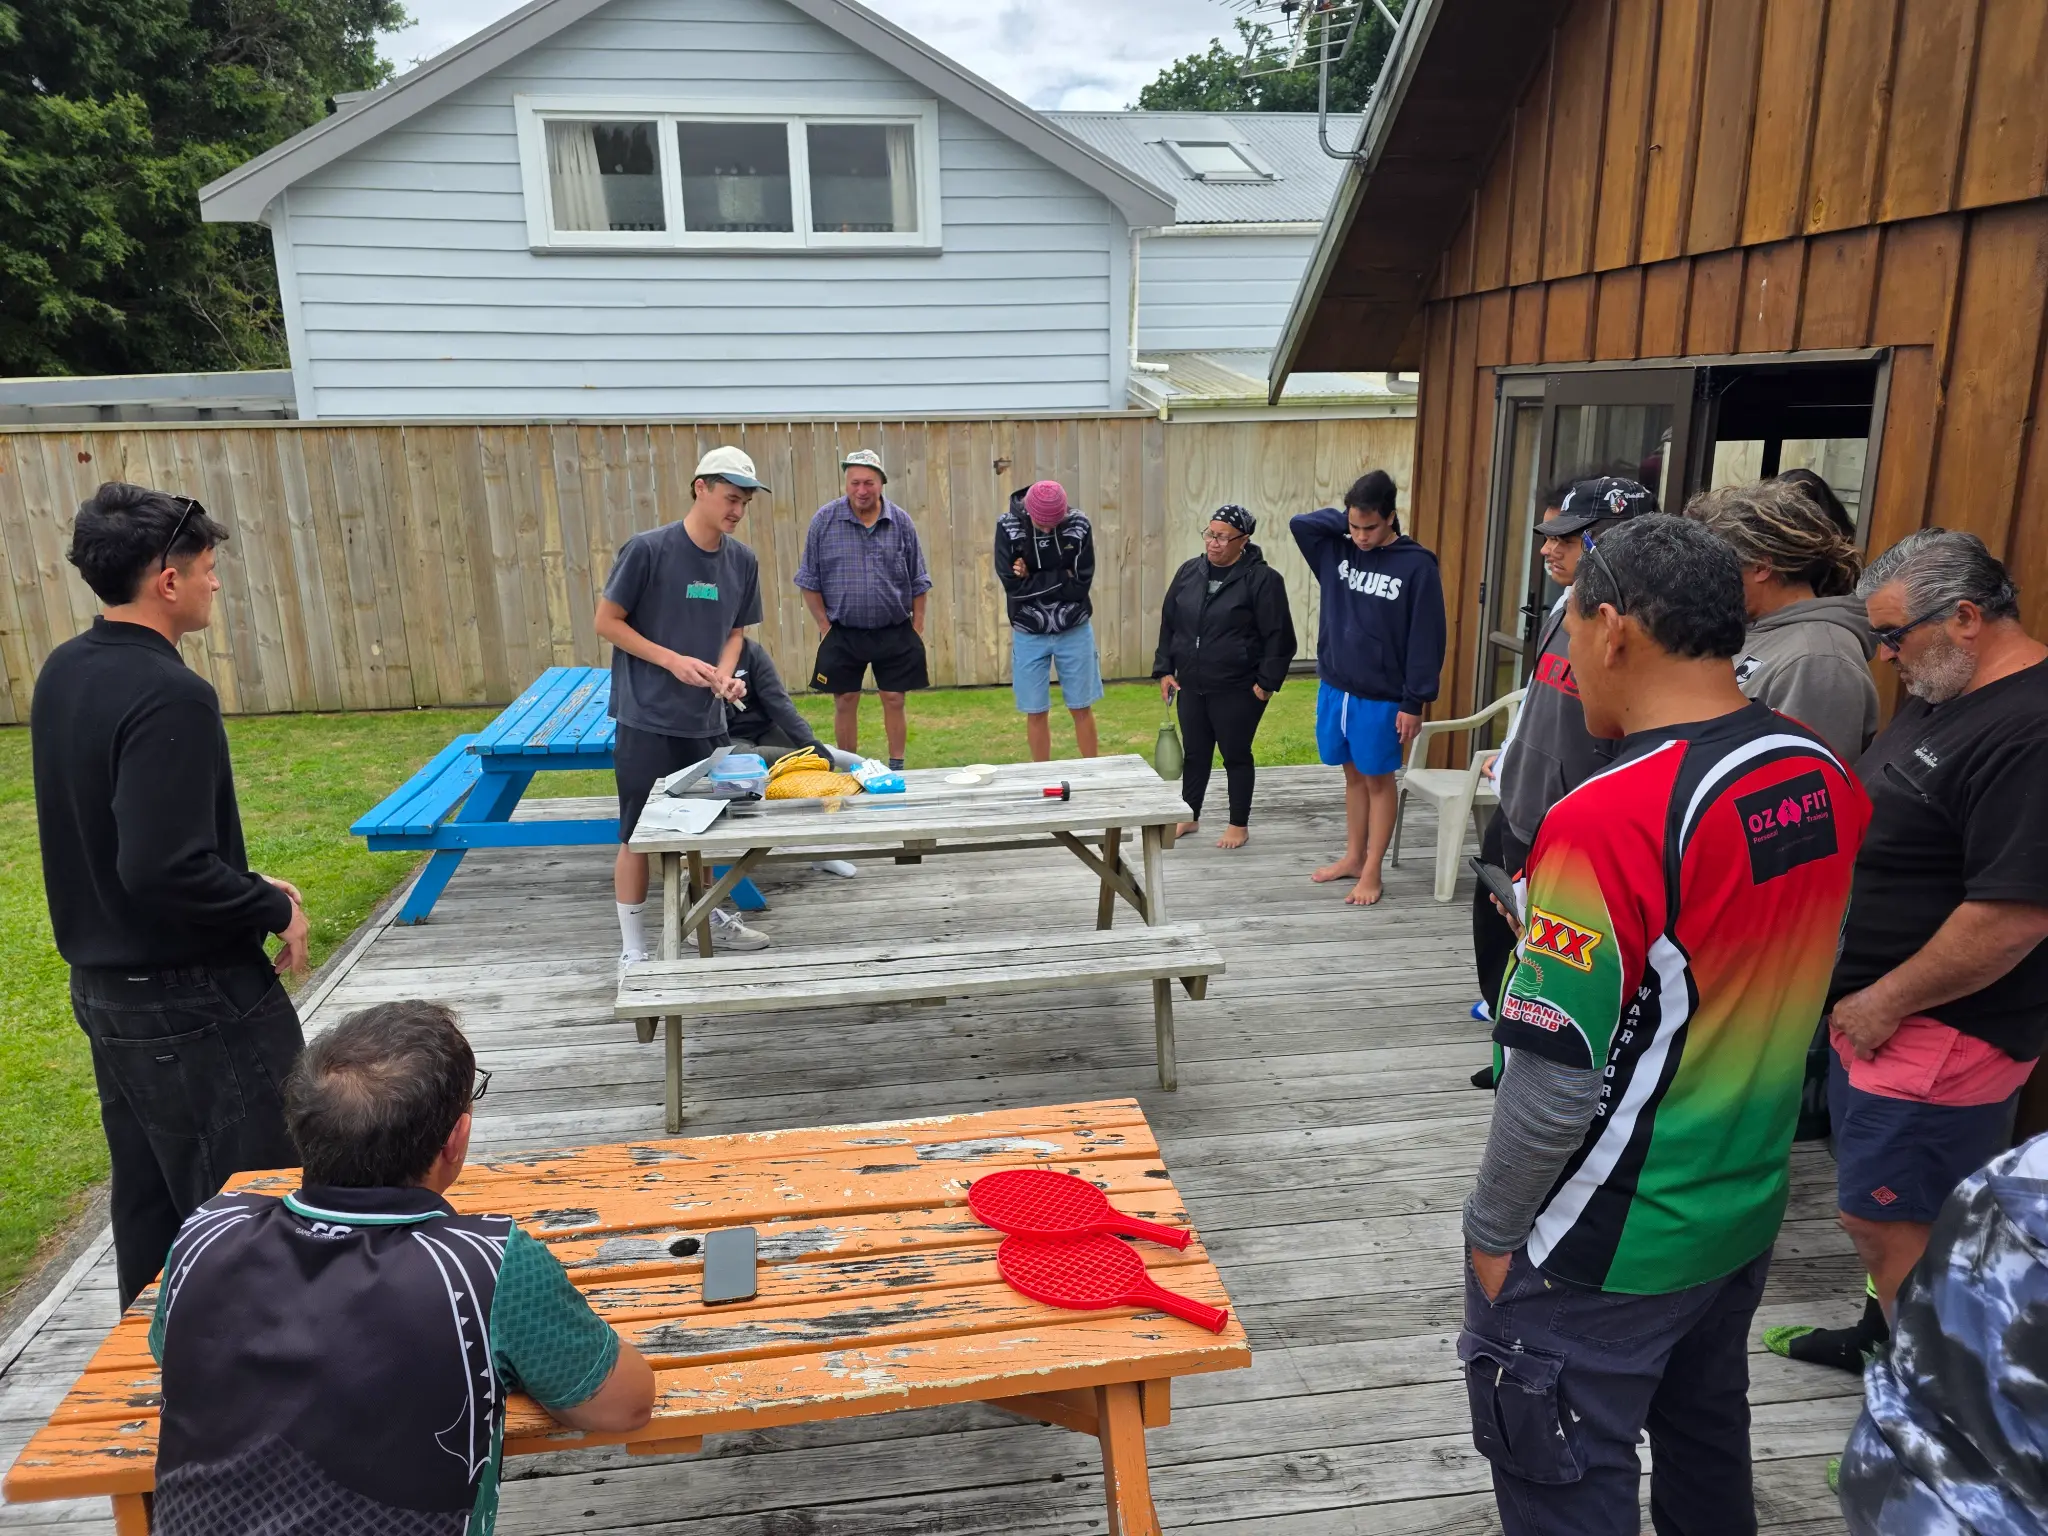
Urenui Divers Club
Team briefing before field work
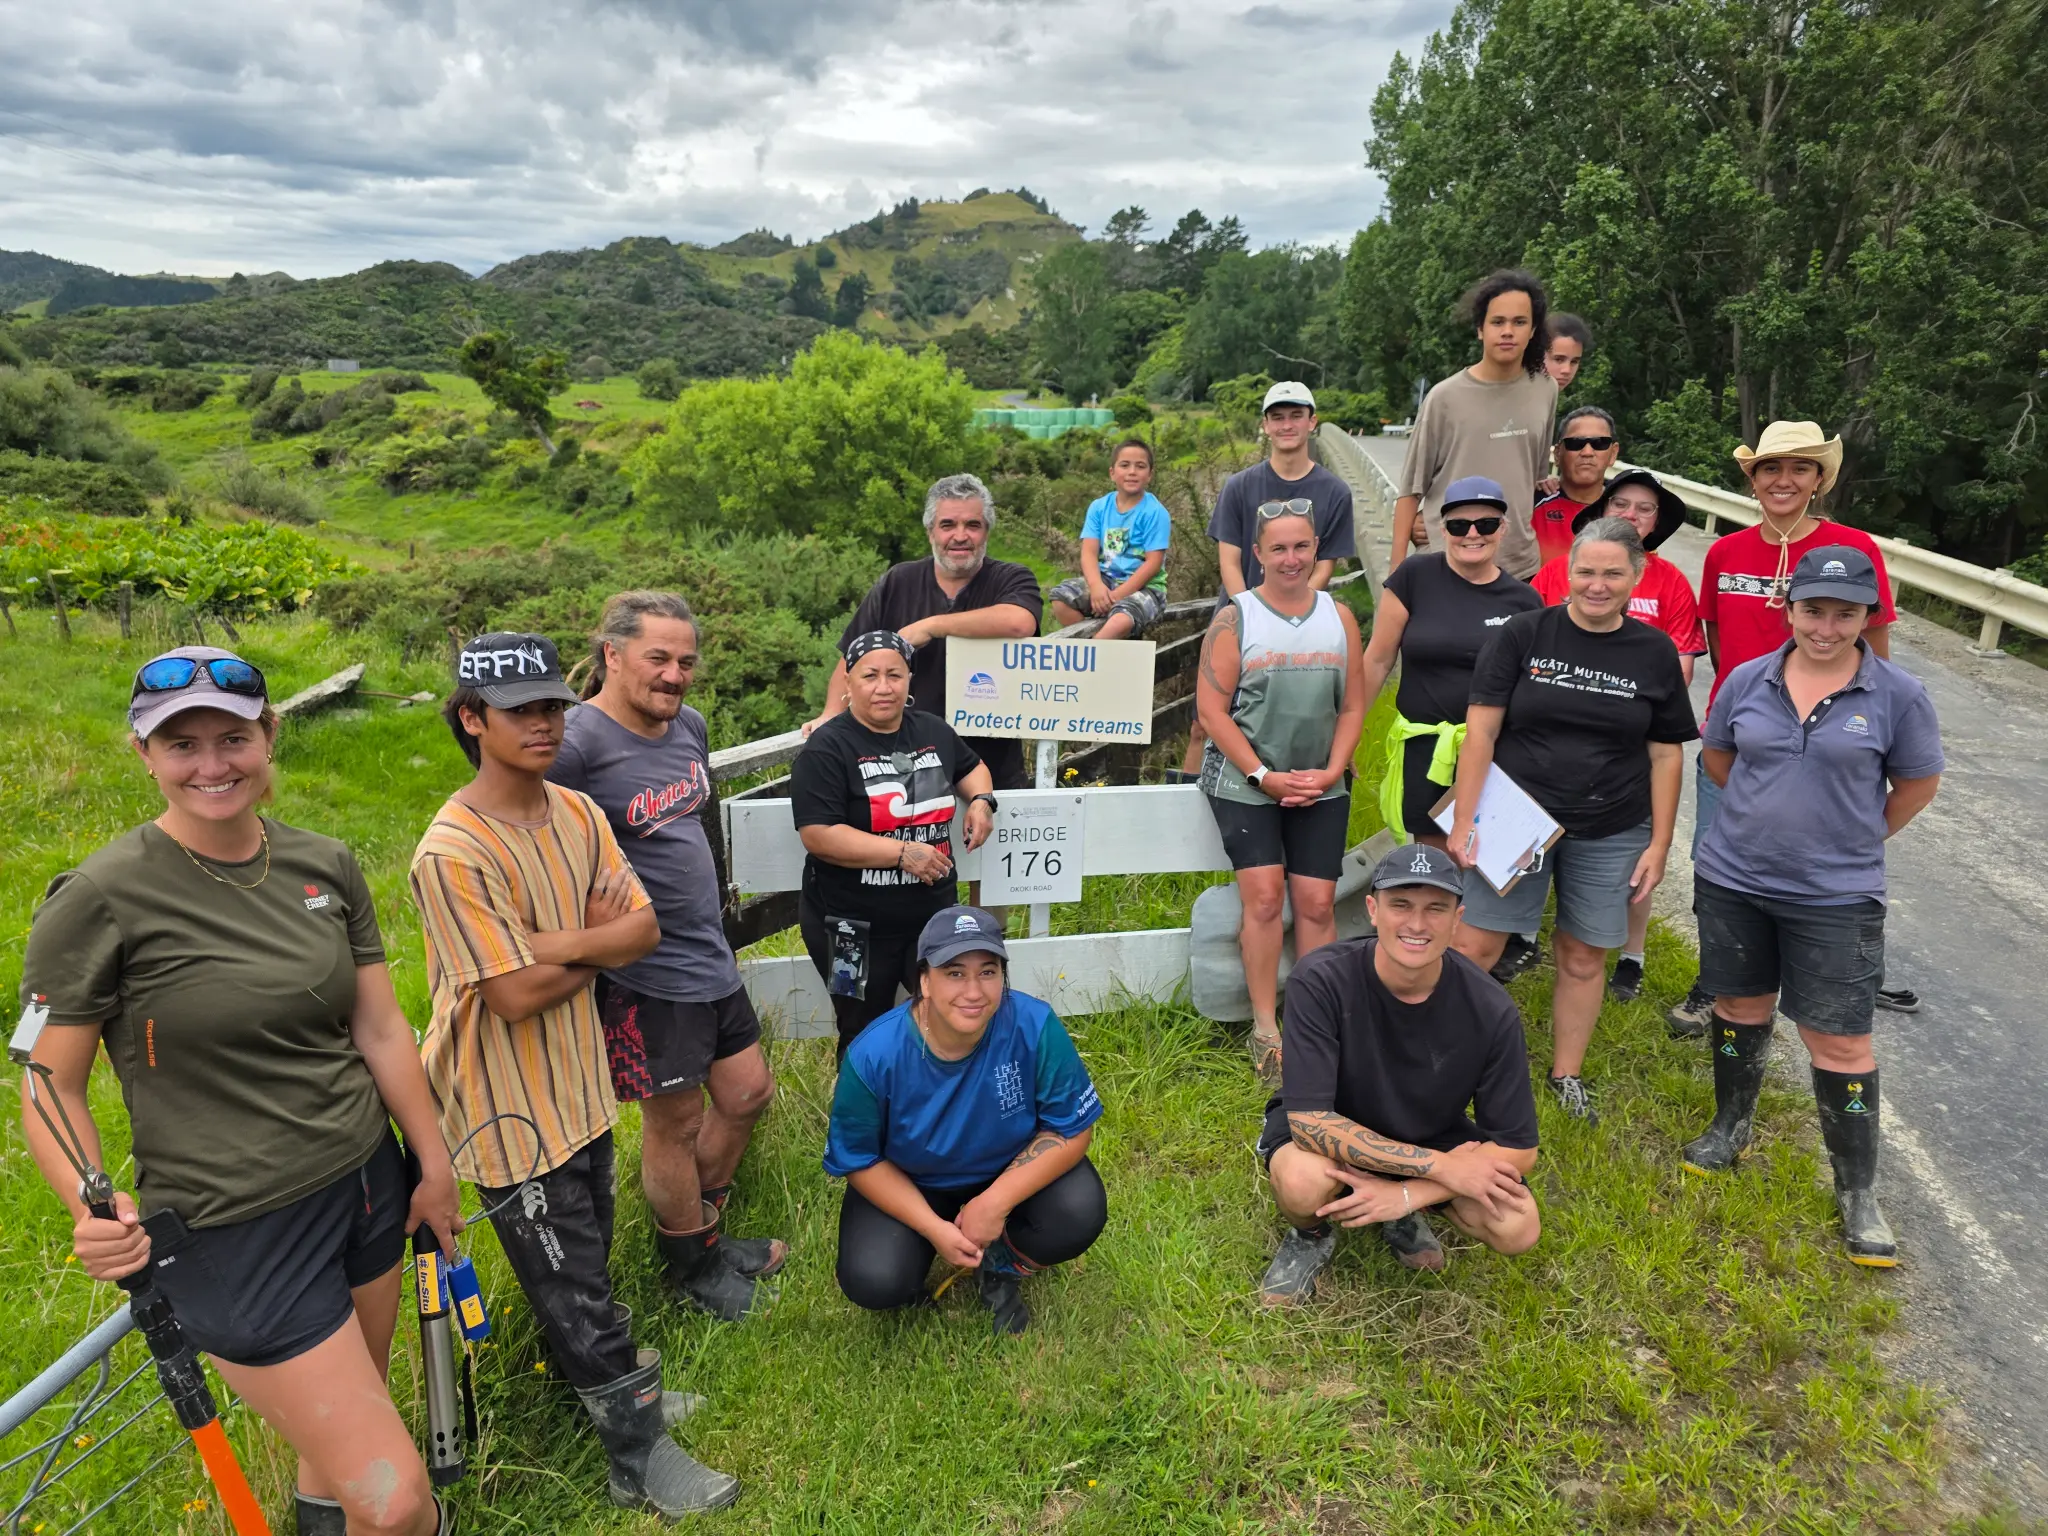
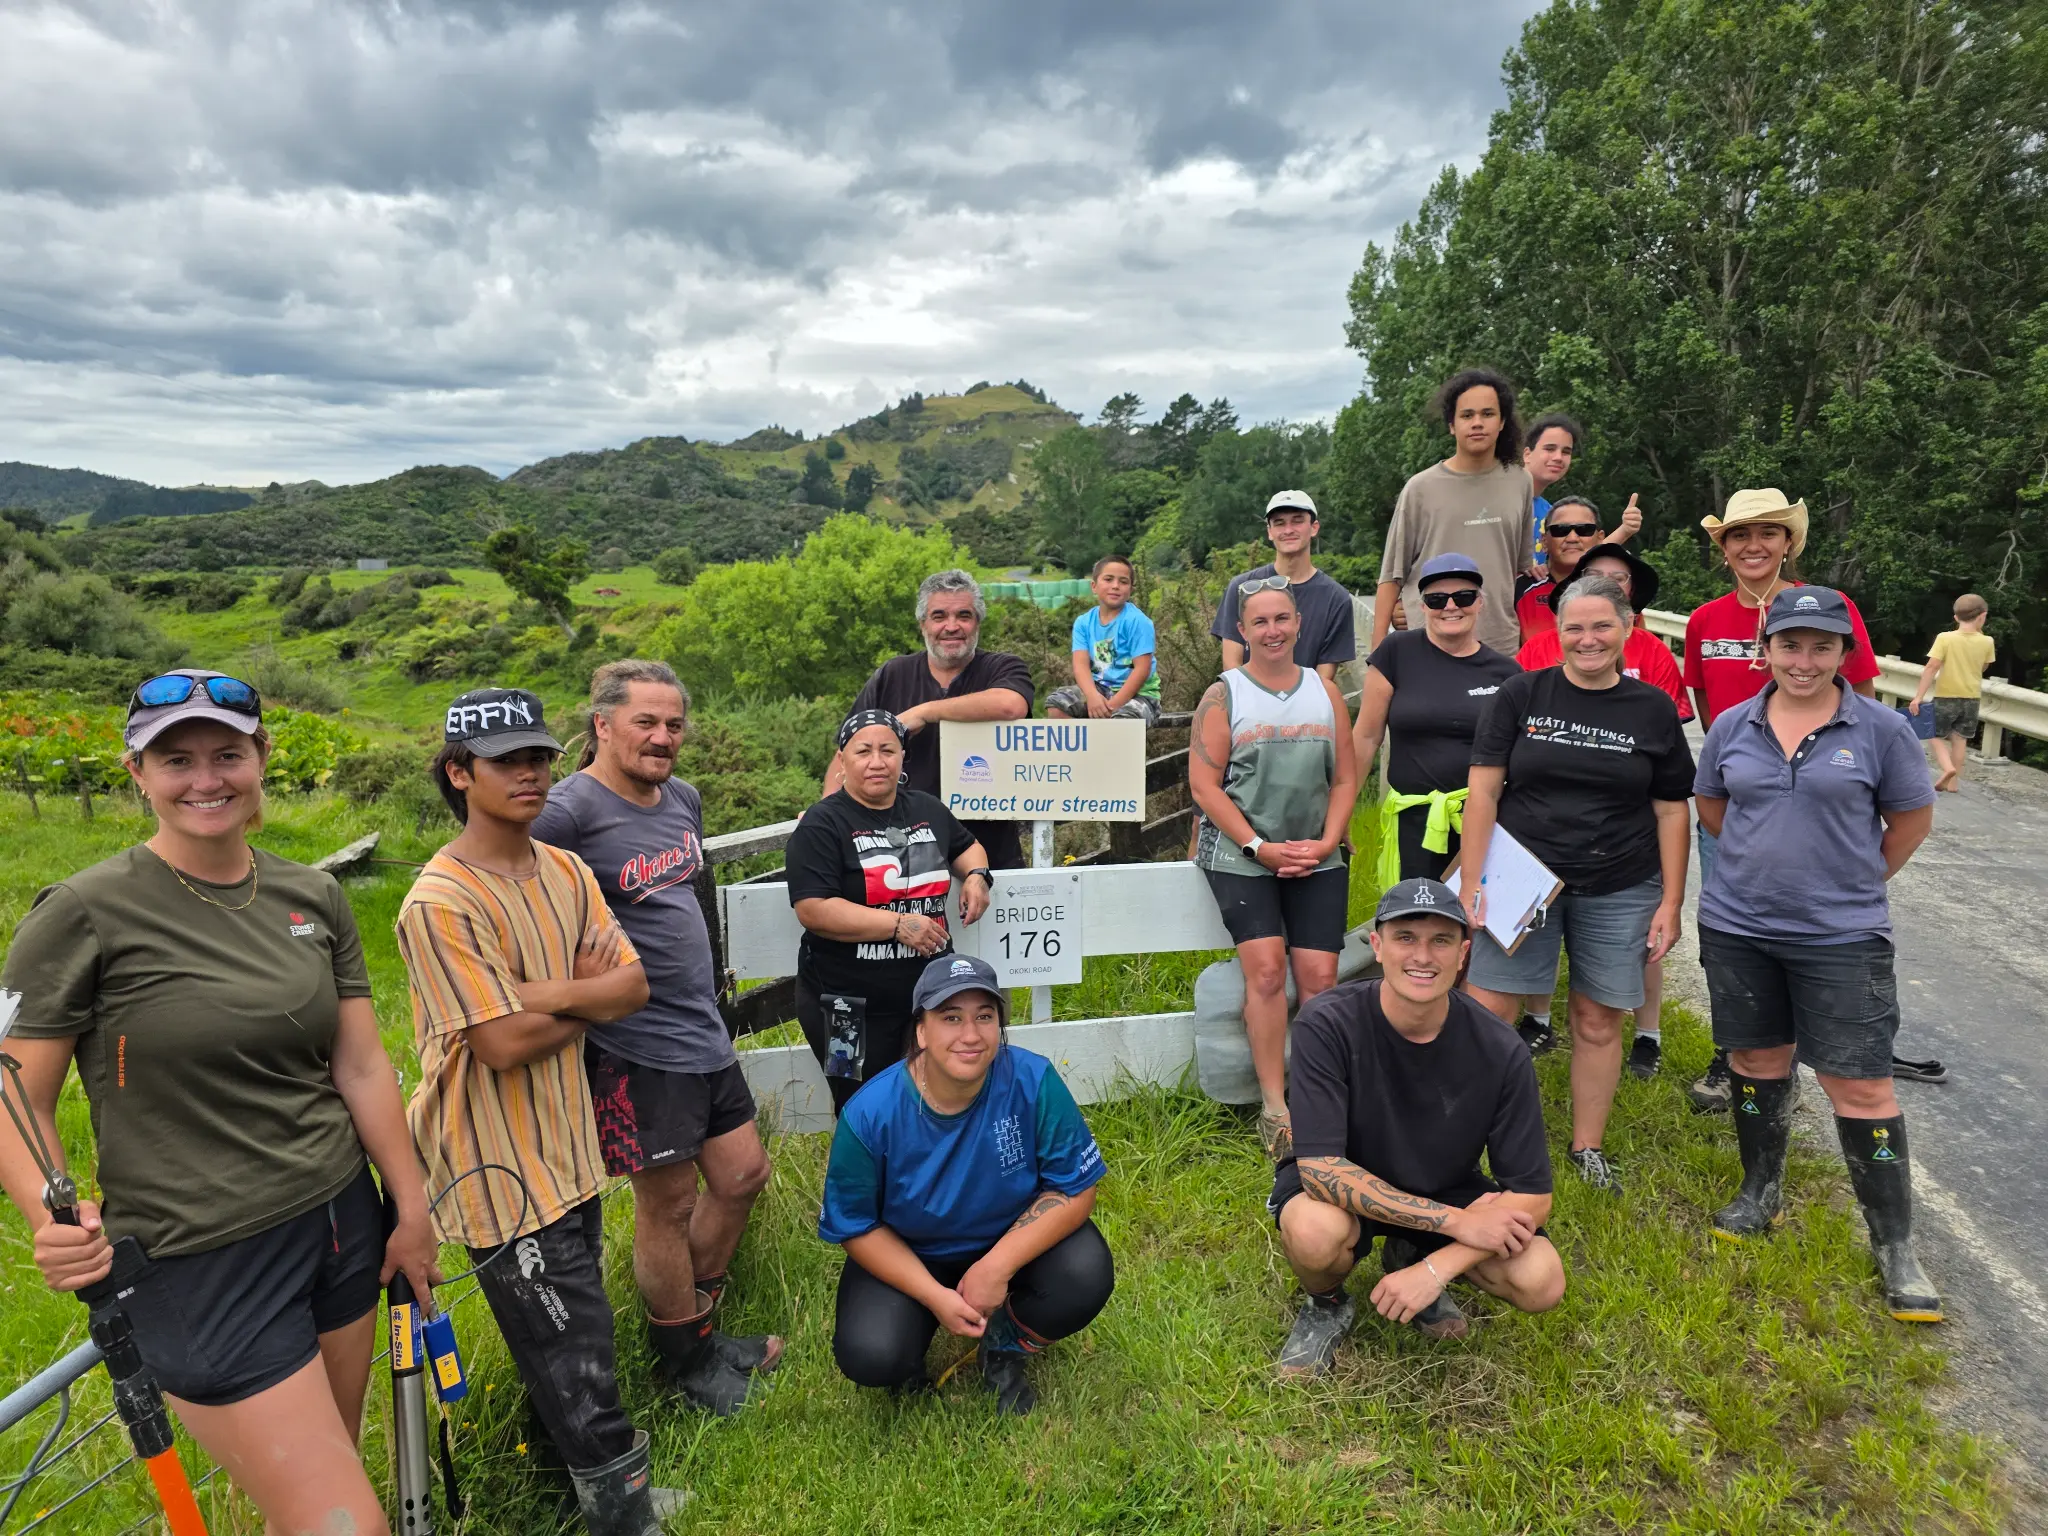
Urenui River Bridge 176
"Protect our streams"
Survey Team in Action
Aerial footage of the survey team conducting fieldwork across the Urenui and Mimitangiatua catchments, January 2026.
Aerial footage of the survey team conducting fieldwork across the Urenui and Mimitangiatua catchments, January 2020.
Biospheres Map


Data from Aqua TROLL 600 multi-parameter sonde (VuSitu)
| Site | pH | Temp (°C) | Clarity (cm) | DO (mg/L) | DO Sat (%) | Turbidity (NTU) | Conductivity (µS/cm) | ORP (mV) |
|---|---|---|---|---|---|---|---|---|
| 1. Mimitangiatua | 6.58 | 20.12 | 44.5 | 8.95 | 98.44% | 13.66 | 103.79 | 203.16 |
| 2. Mangamaio | 6.63 | 23.26 | 35.5 | 8.76 | 102.72% | 36.89 | 111.13 | 234.24 |
| 3. Uruti Stream | 8.17 | 19.57 | 45.5 | 8.68 | 94.71% | 9.82 | 60.28 | 162.31 |
| 4. Mangahia | 6.53 | 21.9 | 48 | 9.94 | 113.71% | 152.52 | 36.87 | 214.29 |
| 5. Mangaoreiti | 6.65 | 19.97 | 94 | 9.1 | 99.98% | 2.74 | 120.9 | 229.08 |
| 6. Okoki Pā | 6.59 | 21.16 | 28 | 8.7 | 97.86% | 23.02 | 94.4 | 230.19 |
| 7. Okoki Bridge | 6.46 | 20.72 | 36 | 8.77 | 97.78% | 18.49 | 91.73 | 223.36 |
| 8. Mangamatou | 6.62 | 20.83 | 55.5 | 8.37 | 93.77% | 9.72 | 109.96 | 226.89 |
Parameter Key:
pH: Acidity/alkalinity. Healthy range: 6.5-8.5. Most NZ streams: 6.5-7.5.
Temperature: Water temp in °C. Tuna prefer 15-25°C.
Clarity: Visibility depth in cm (clarity tube). Higher = clearer water.
DO (Dissolved Oxygen): Oxygen in water. Healthy: 6-10 mg/L. Below 5 mg/L stresses fish.
DO Saturation: % of max oxygen capacity. 80-120% is healthy.
Turbidity: Water cloudiness in NTU. <10 = very clear, 10-50 = moderate, >50 = turbid.
Conductivity: Dissolved minerals in µS/cm. NZ streams typically 50-200 µS/cm.
ORP: Oxidation-Reduction Potential in mV. Healthy streams: 150-300 mV. Indicates water's ability to break down contaminants.
2020 vs 2026 Survey Comparison
Comparing data from the February 2020 Mauri Compass assessment with the January 2026 survey.View 2020 Report
2020 Total Tuna
~32
across 8 Biospheres
2026 Total Tuna
139
across 8 Biospheres
Increase
+334%
more tuna captured
Number of tuna captured at each site in 2020 vs 2026
- 2020
- 2026
Significant increases observed at most Biospheres, particularly Okoki Bridge (3 to 41), Mangamaio (3 to 18), and Okoki Pā (1 to 17).
Clarity tube measurements (cm) - higher values indicate clearer water
- 2020
- 2026
Mangaoreiti showed improved clarity (58 to 94cm). Most Biospheres had reduced clarity in 2026, likely due to 61.2mm rainfall in the prior 7 days.
Biospheres 1-4: Mimitangiatua, Mangamaio, Uruti Stream, Mangahia
- Pre-European
- 2020
- 2026 (Estimates)
59 tuna caught across 4 Biospheres. Strong biodiversity with 5 native species including Banded Kōkopu and Īnanga.
Key Finding: The 2026 estimates show improvement in tuna-focused indicators compared to 2020, with abundance increasing significantly (particularly in Urenui catchment). However, all indicators remain well below pre-European levels, highlighting the ongoing need for restoration efforts. Note: 2026 values are estimates pending formal Mauri Compass assessment.
Tuna Data Analysis
Total tuna captured at each sampling location
Okoki Bridge recorded the highest catch (41 tuna), followed by Mangahia and Mangamaio (18 each). Total: 139 tuna across 8 Biospheres.
- Mangahia
- Uruti Stream
- Mangamaio
- Mangamatou
- Mimitangiatua
- Okoki Pā
- Okoki Bridge
- Mangaoreiti
- Elver
- Sub-adult
- Adult
- Large Adult
Field Calculator
Tuna Length-Weight Estimator
A helpful backup tool when scale batteries fail or the tape measure is forgotten. Based on regression analysis of our survey data (R² = 86%).
Formula
Weight (g) = 0.155 × Length2.1
Note: This provides an approximation. Actual weights vary based on tuna condition and species.
Enter a measurement to estimate the other:
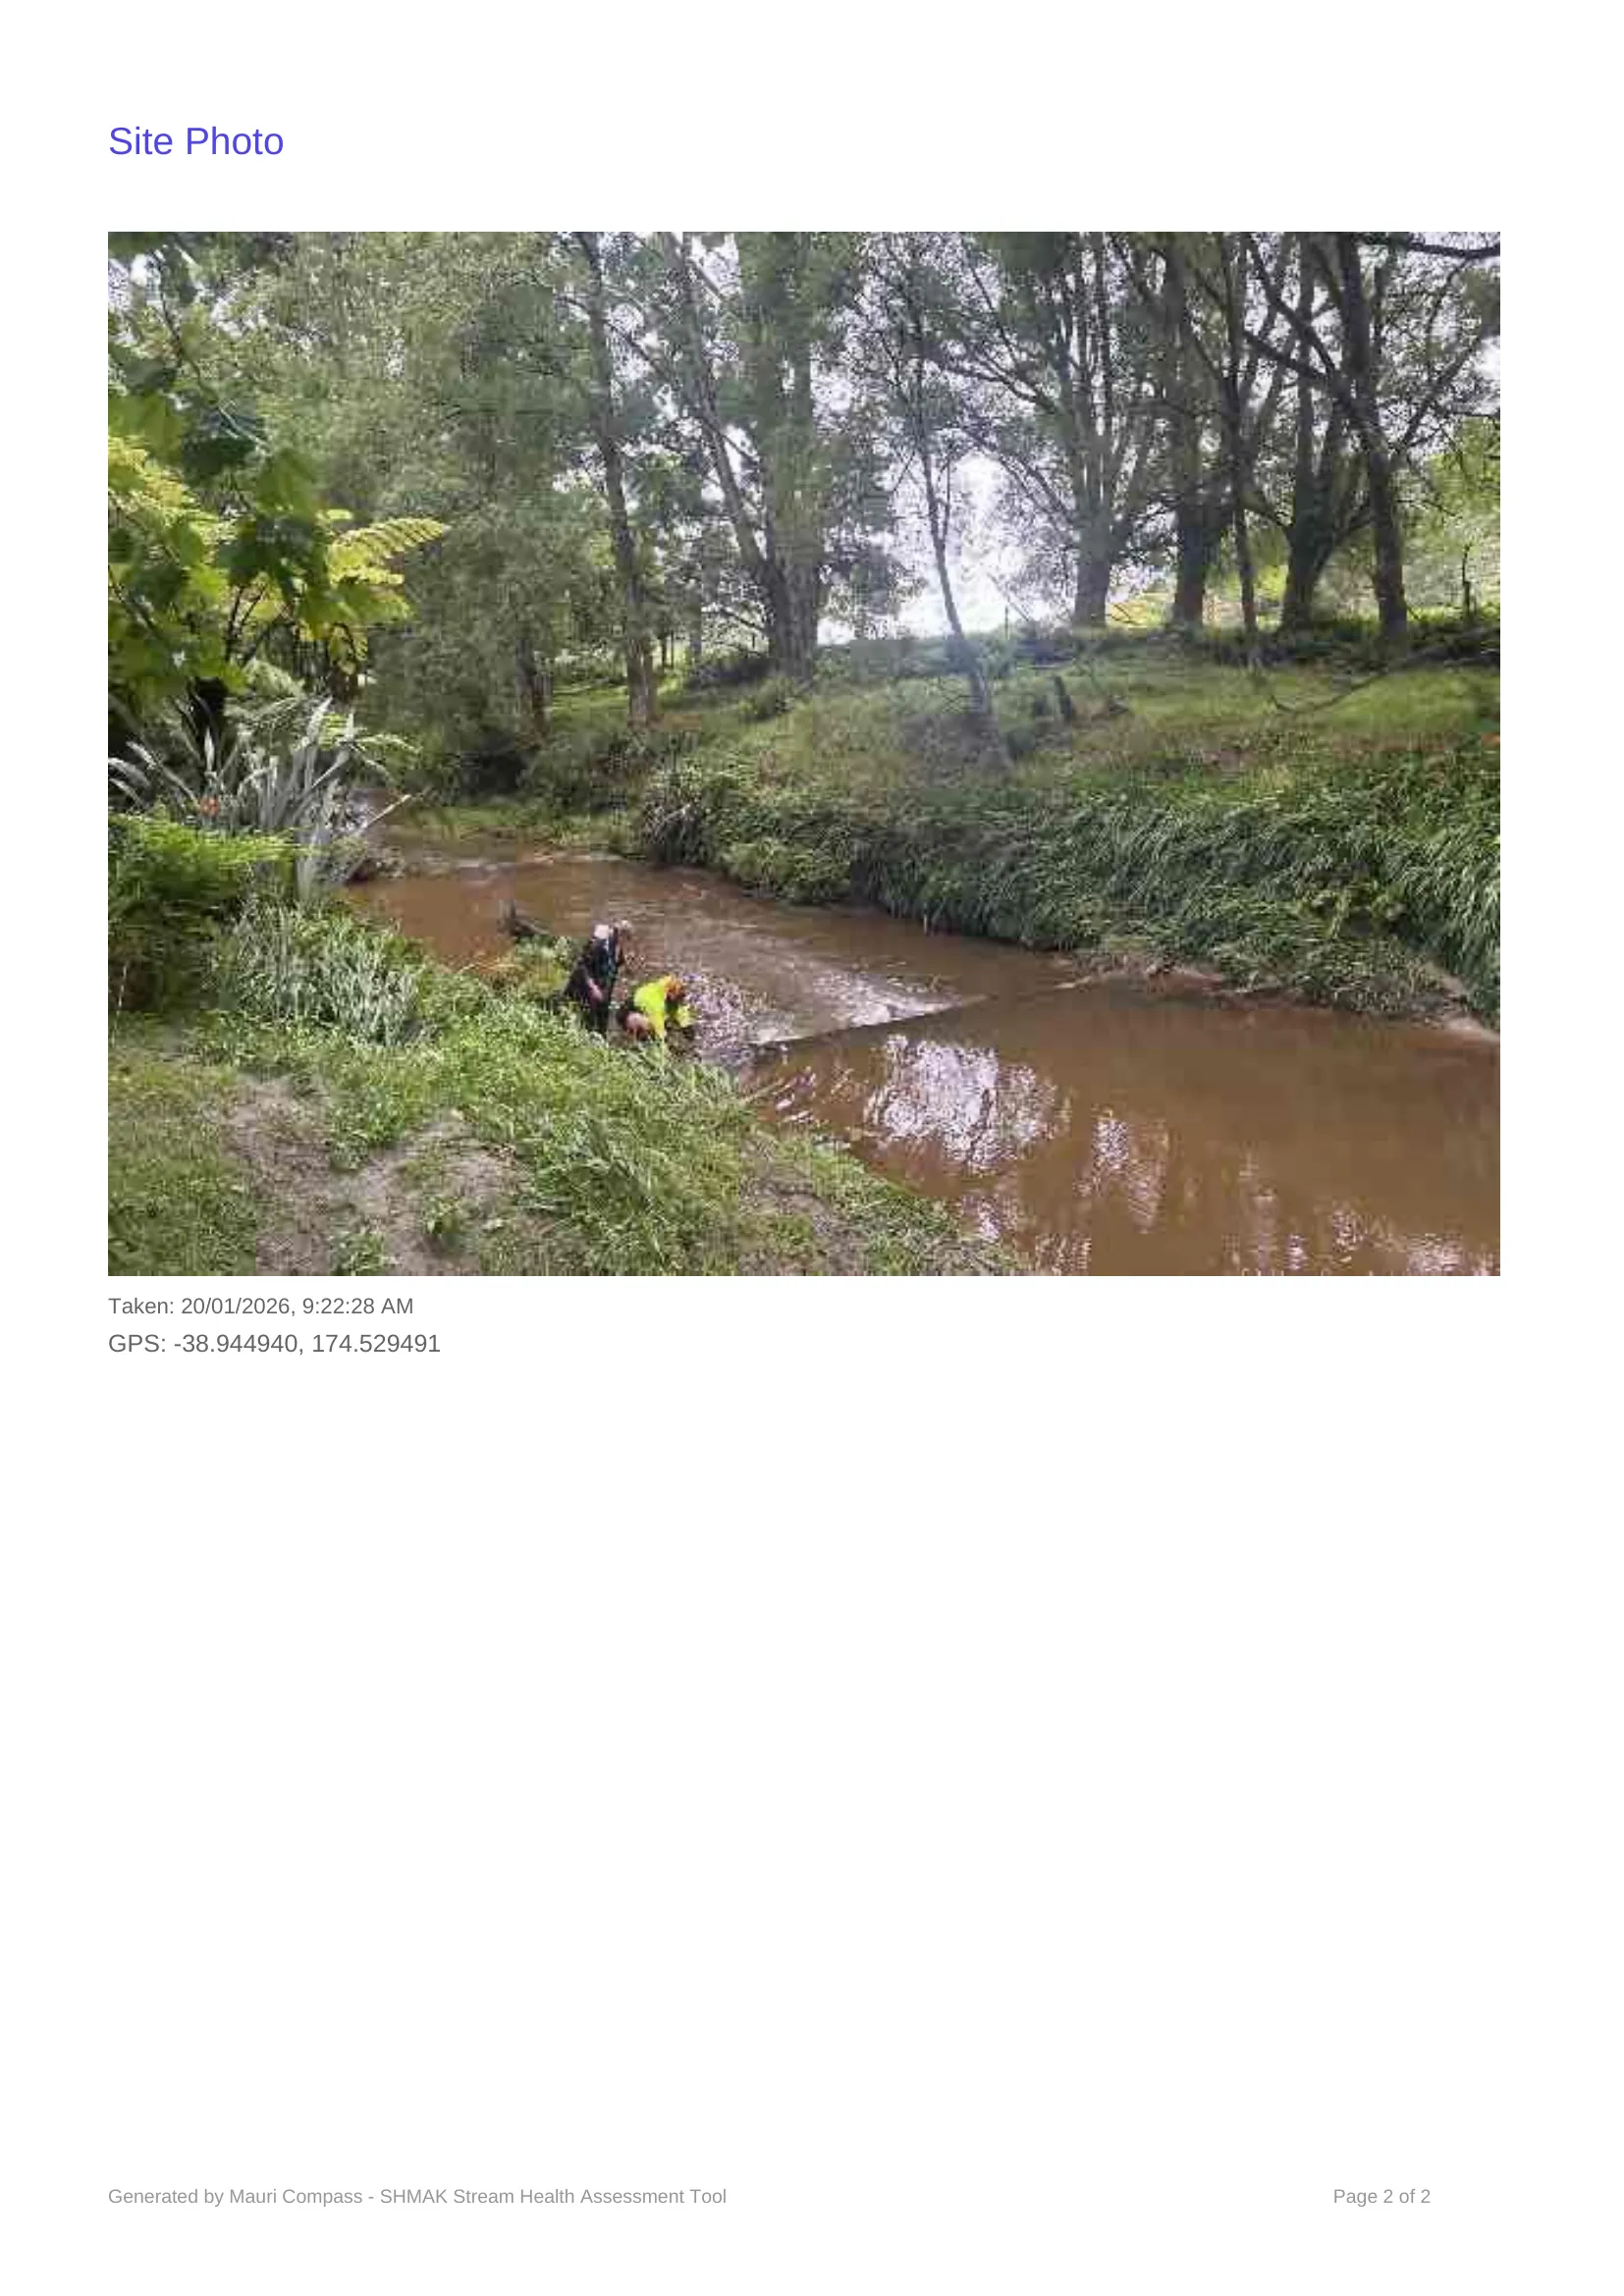
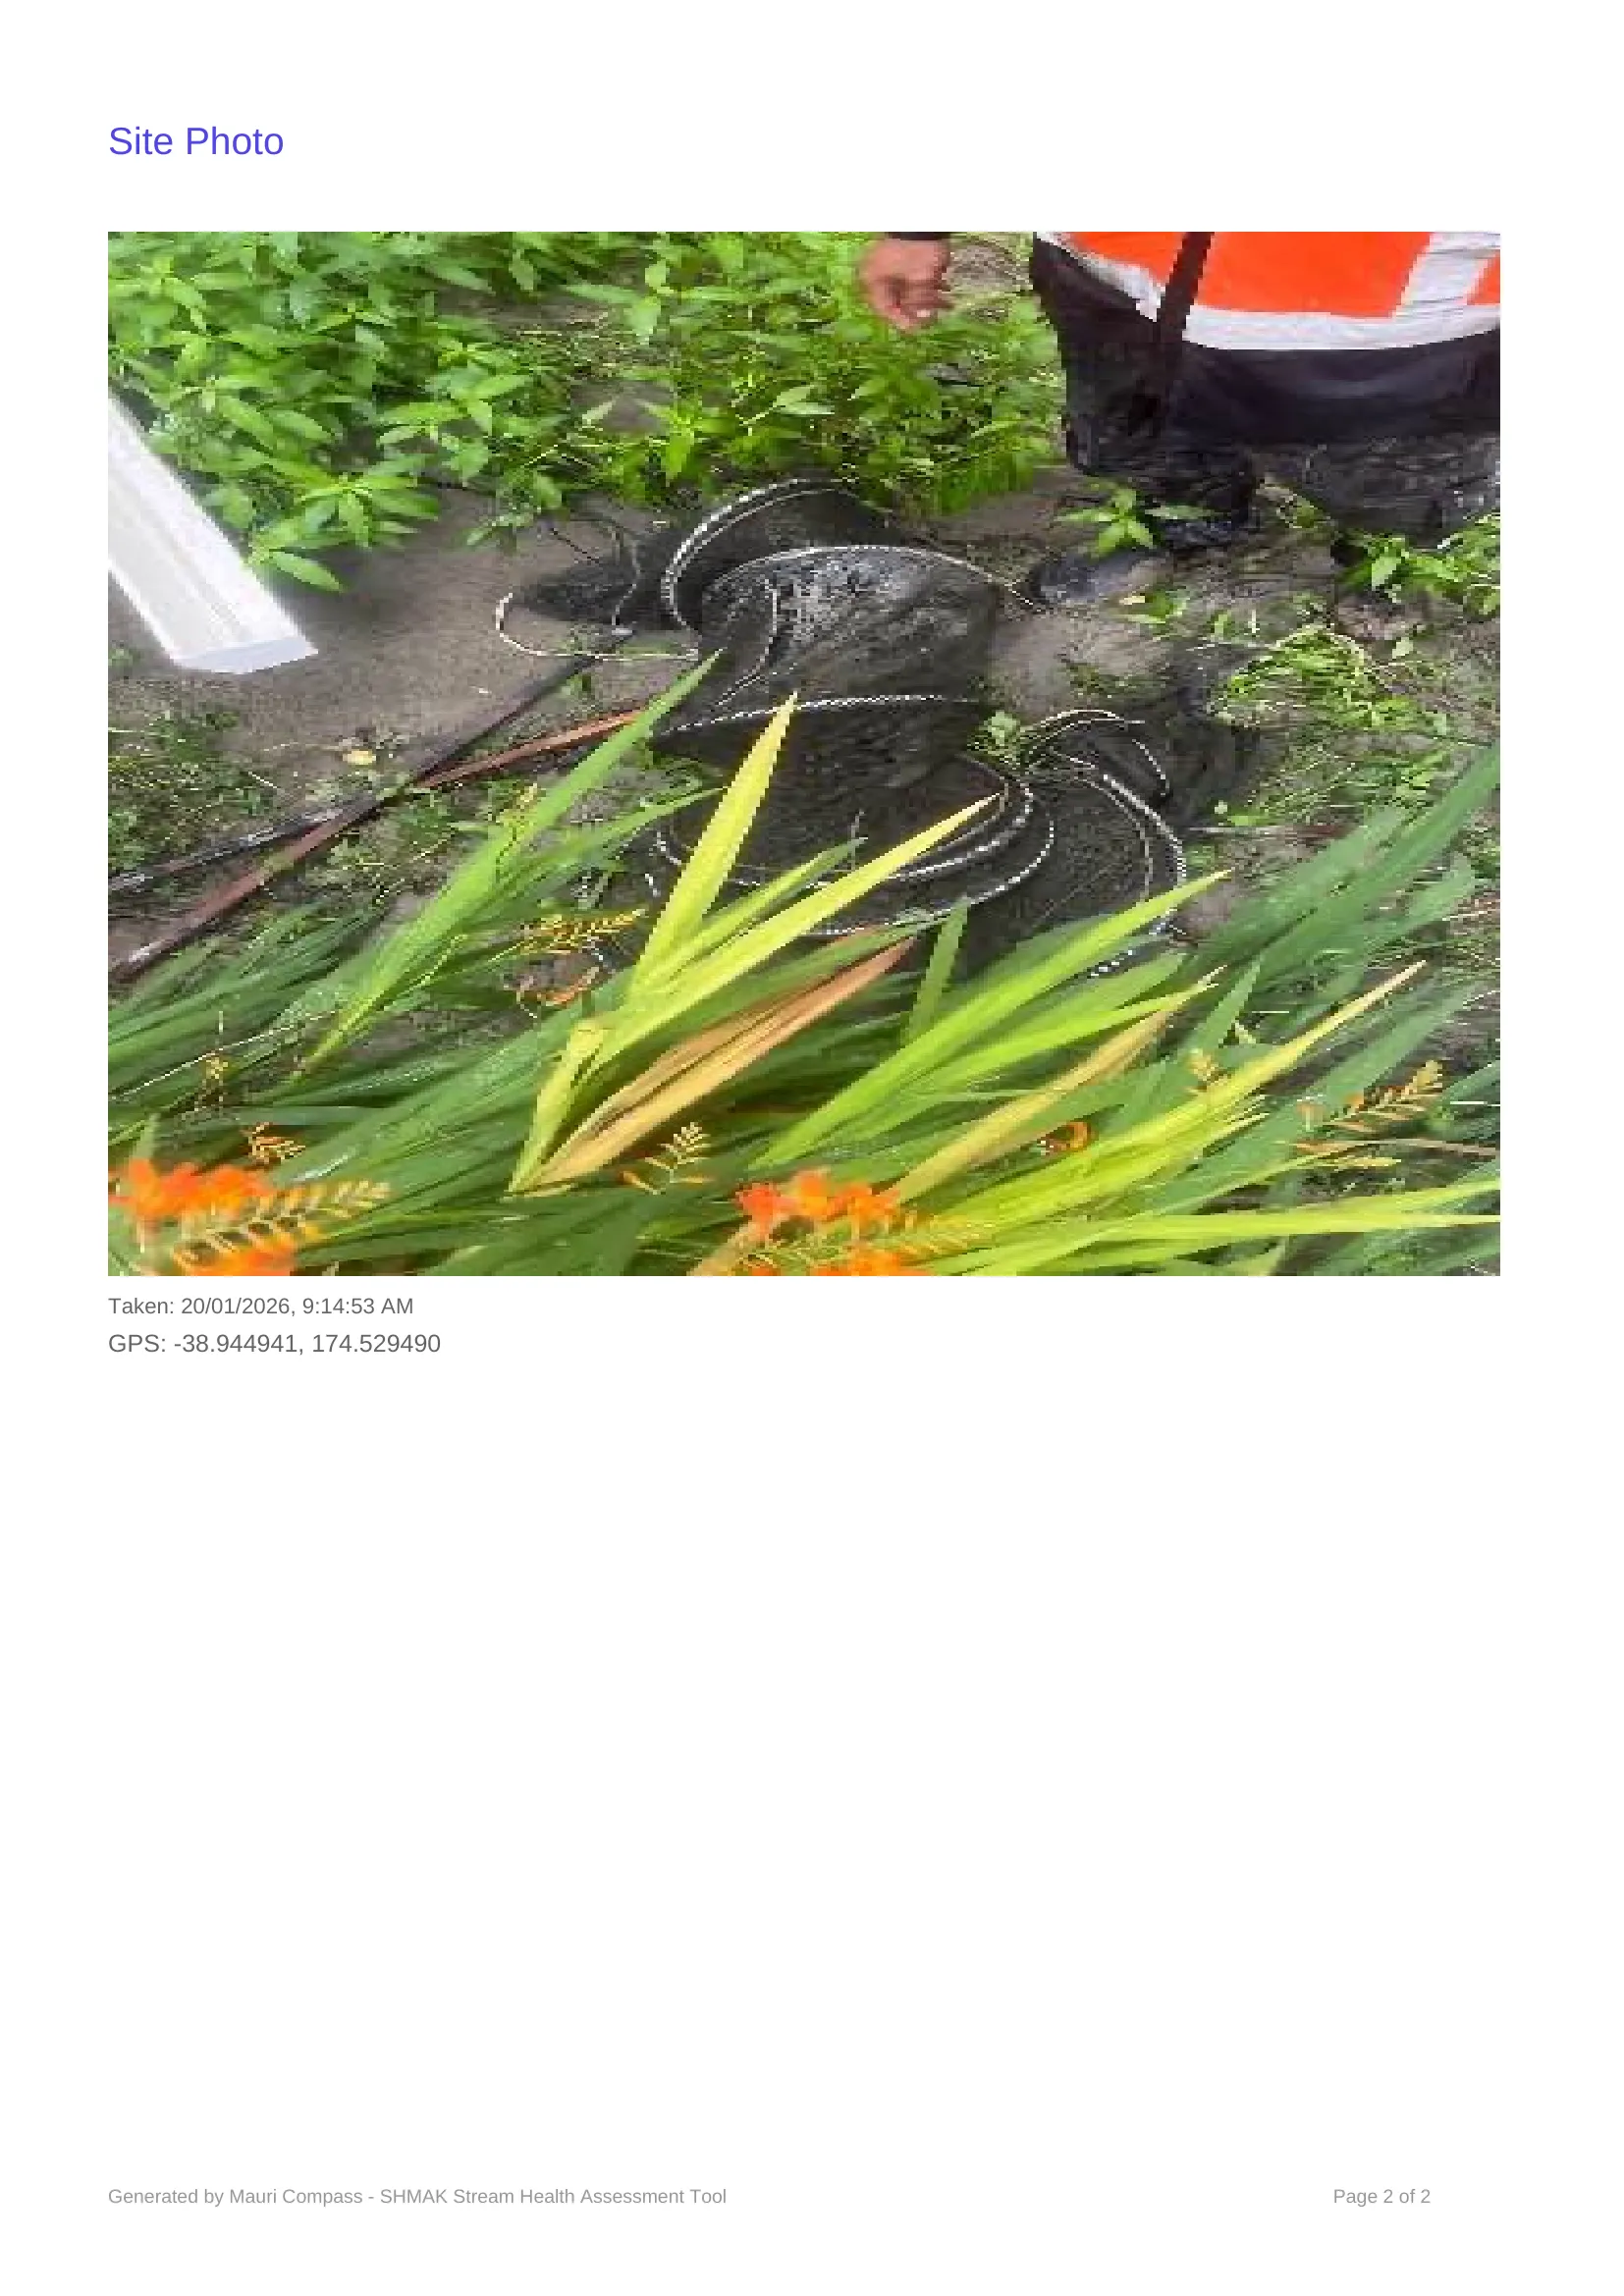
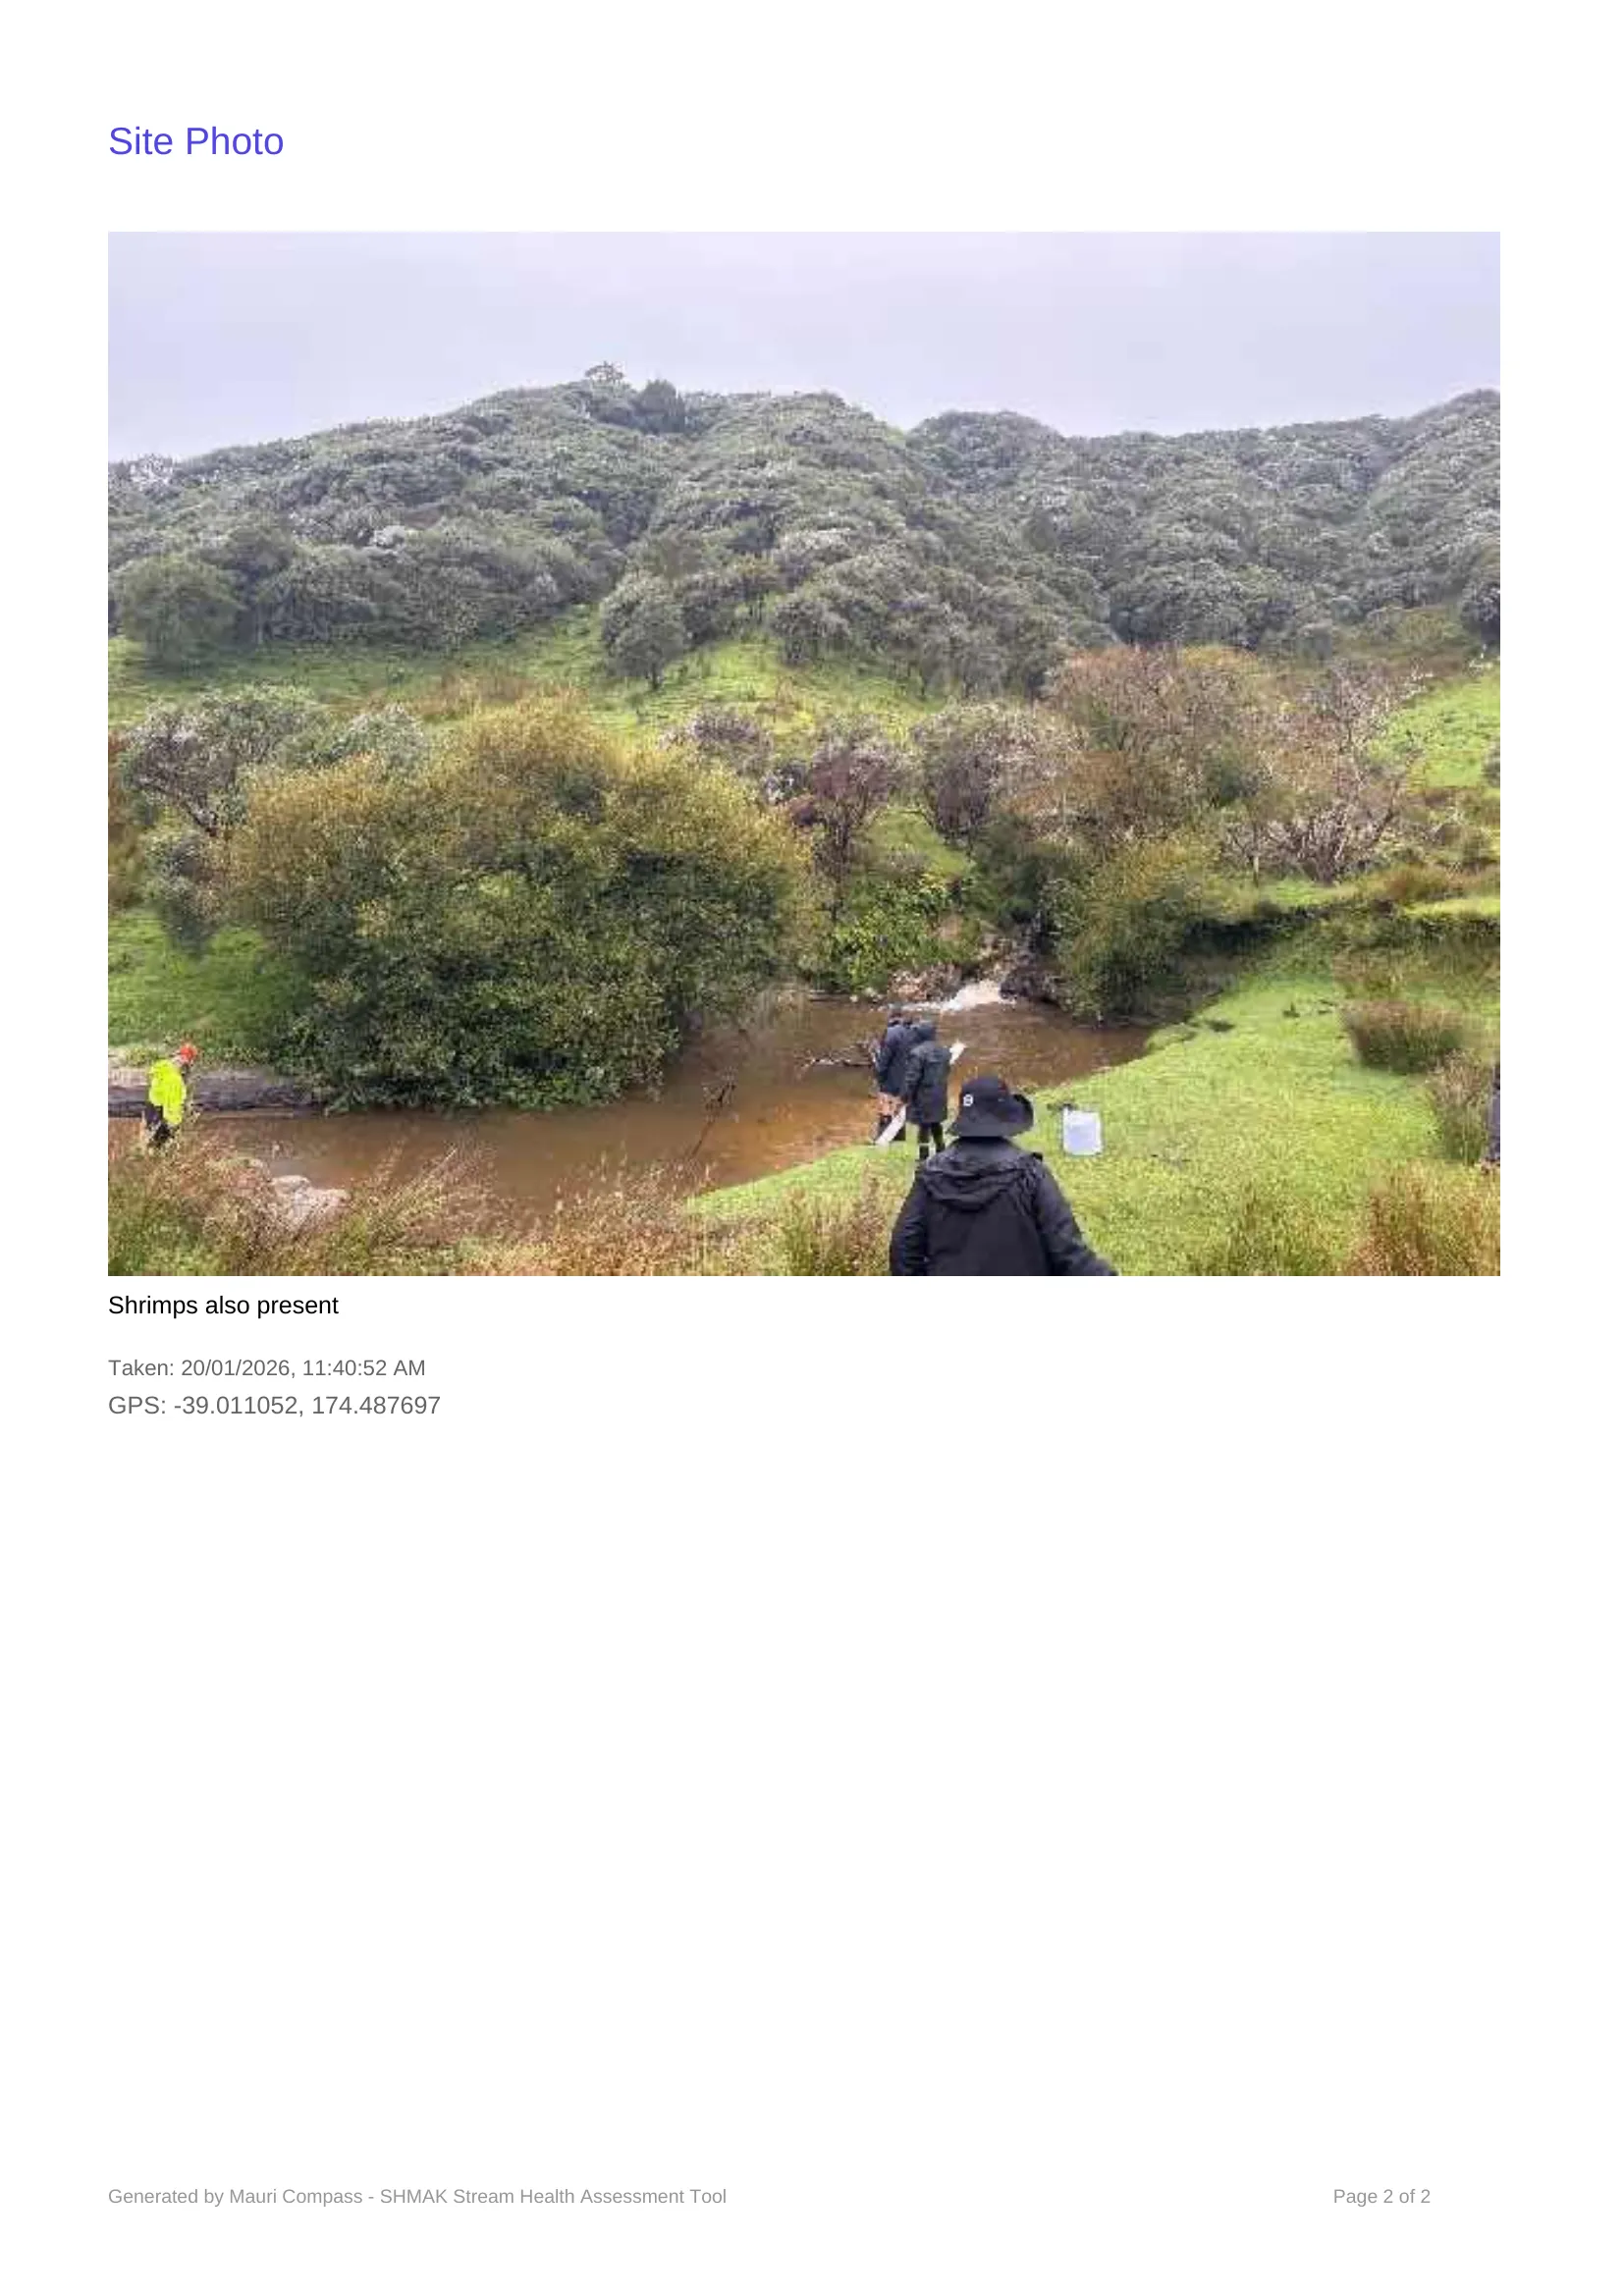
Site Photo Gallery
1Mimitangiatua(4 fish species, 1 invertebrate types)
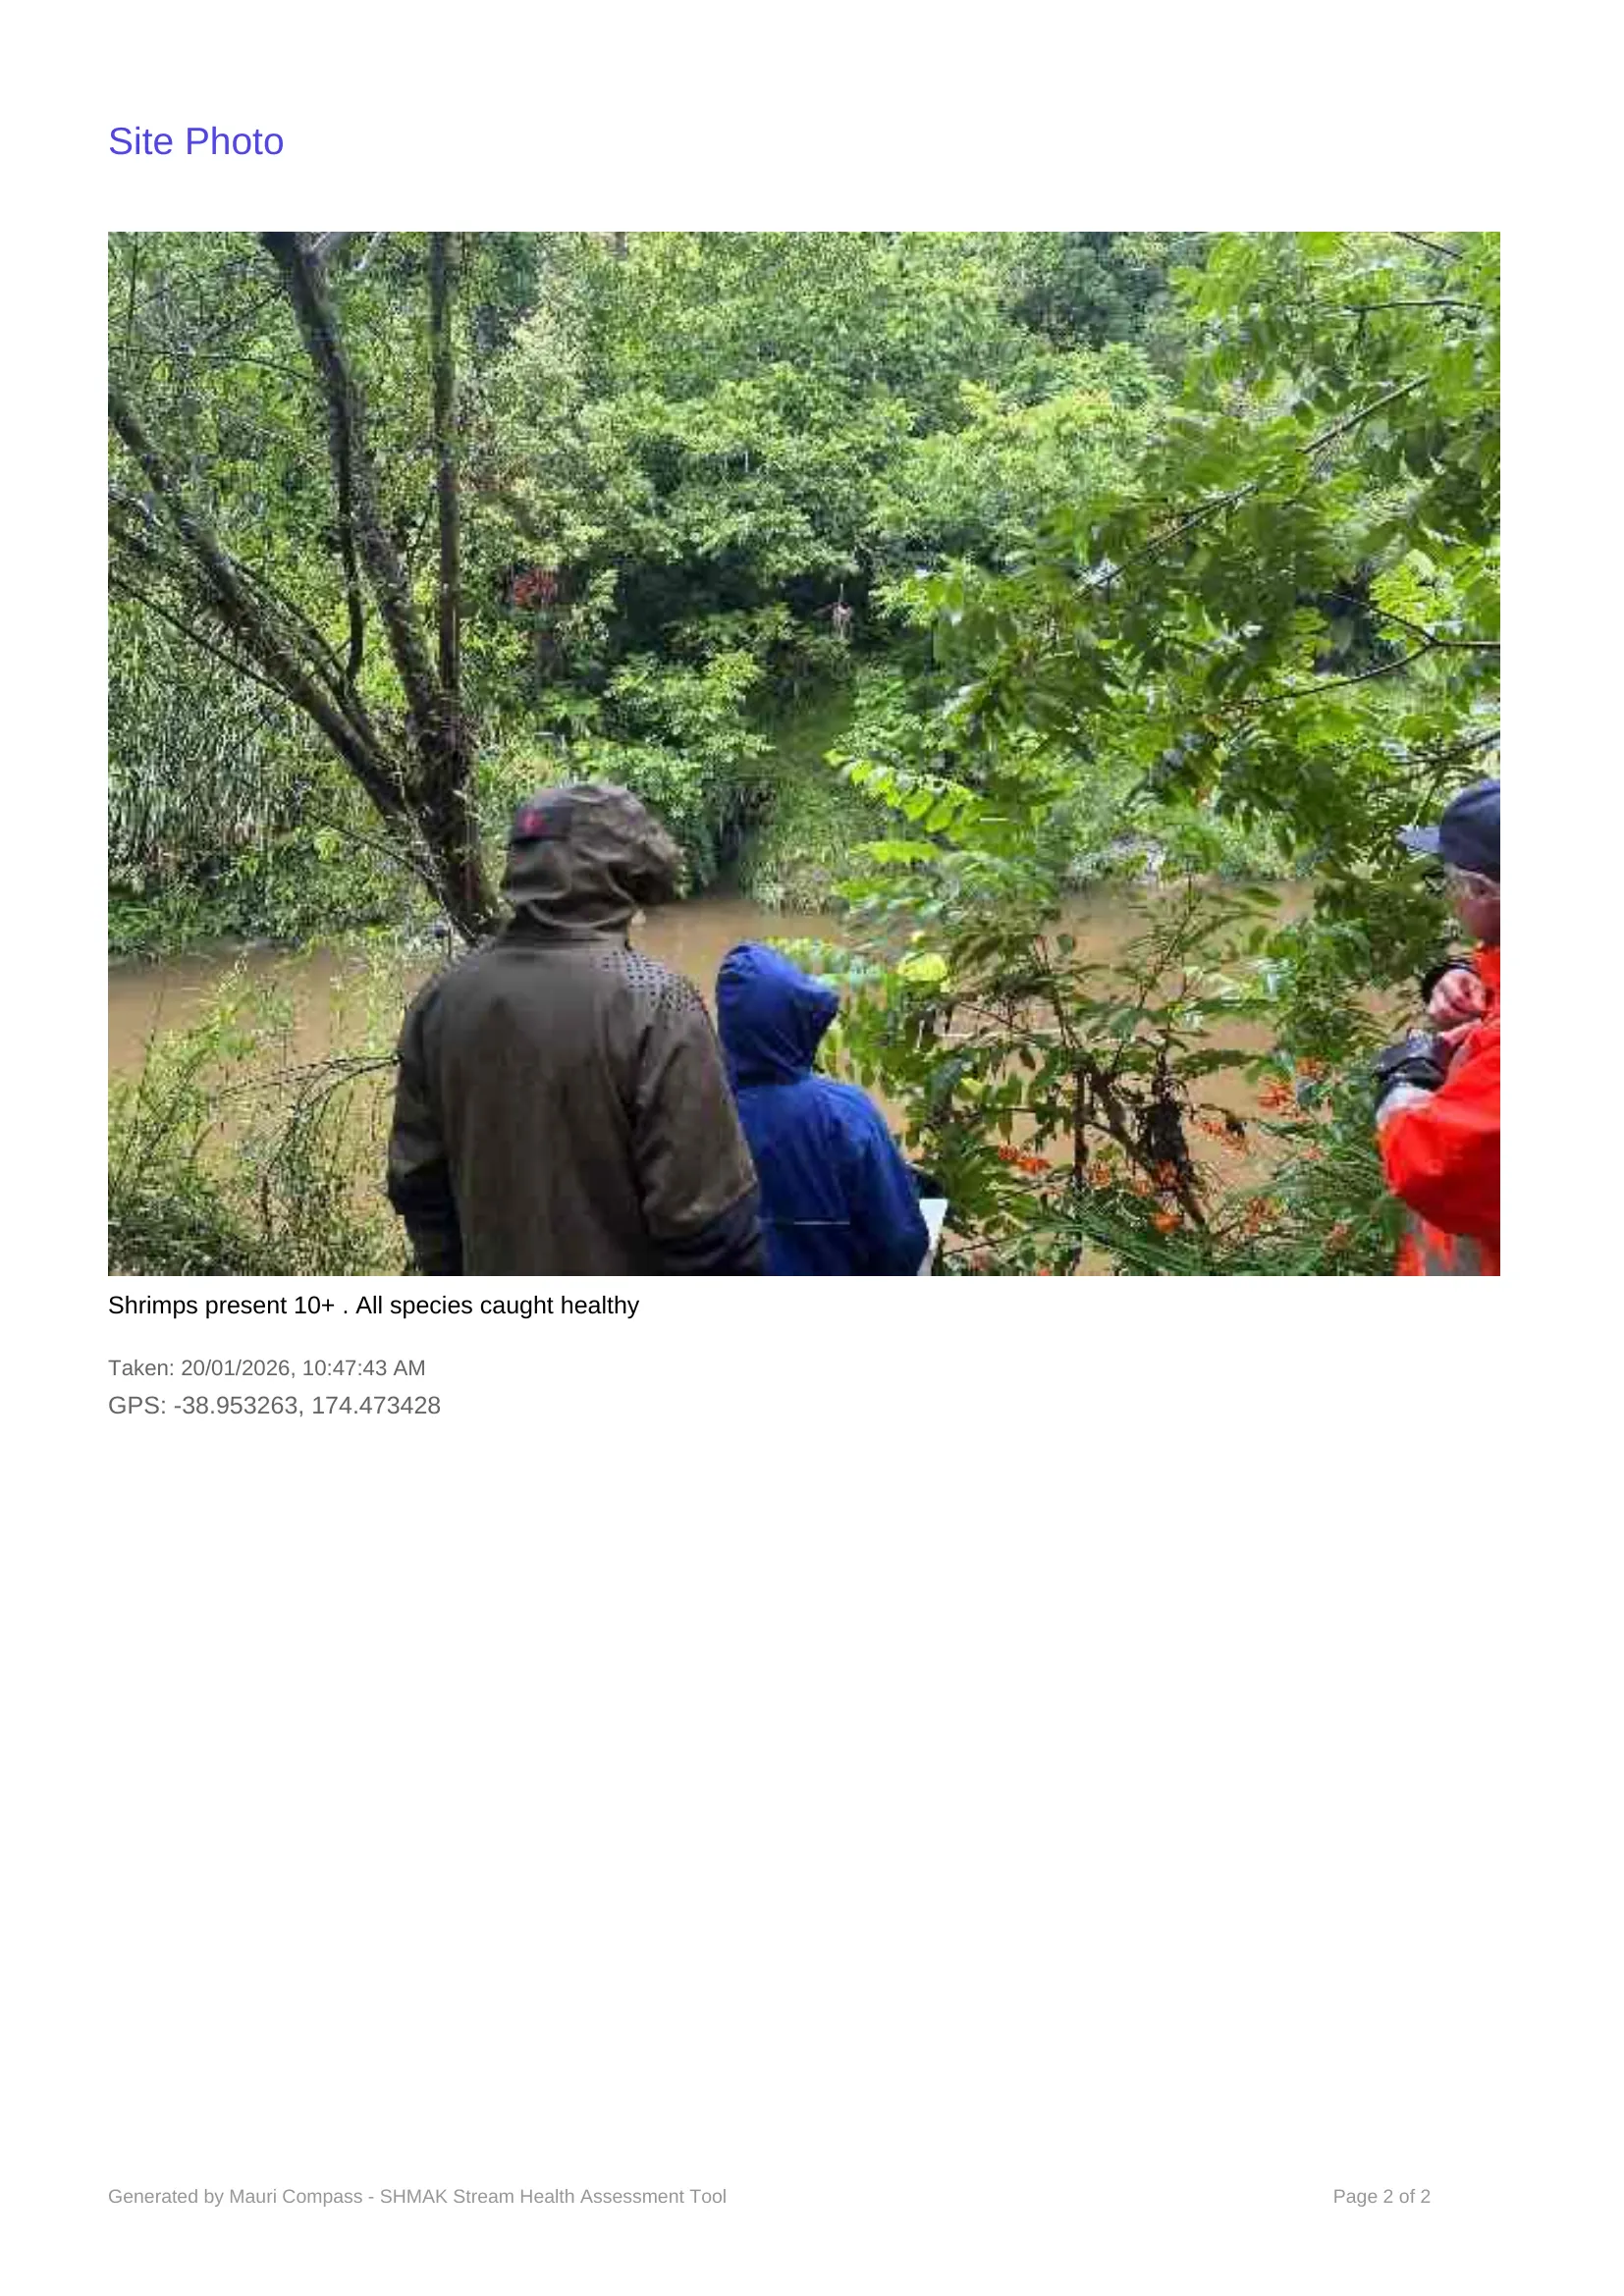
Riaki's Net
10+ shrimps observed
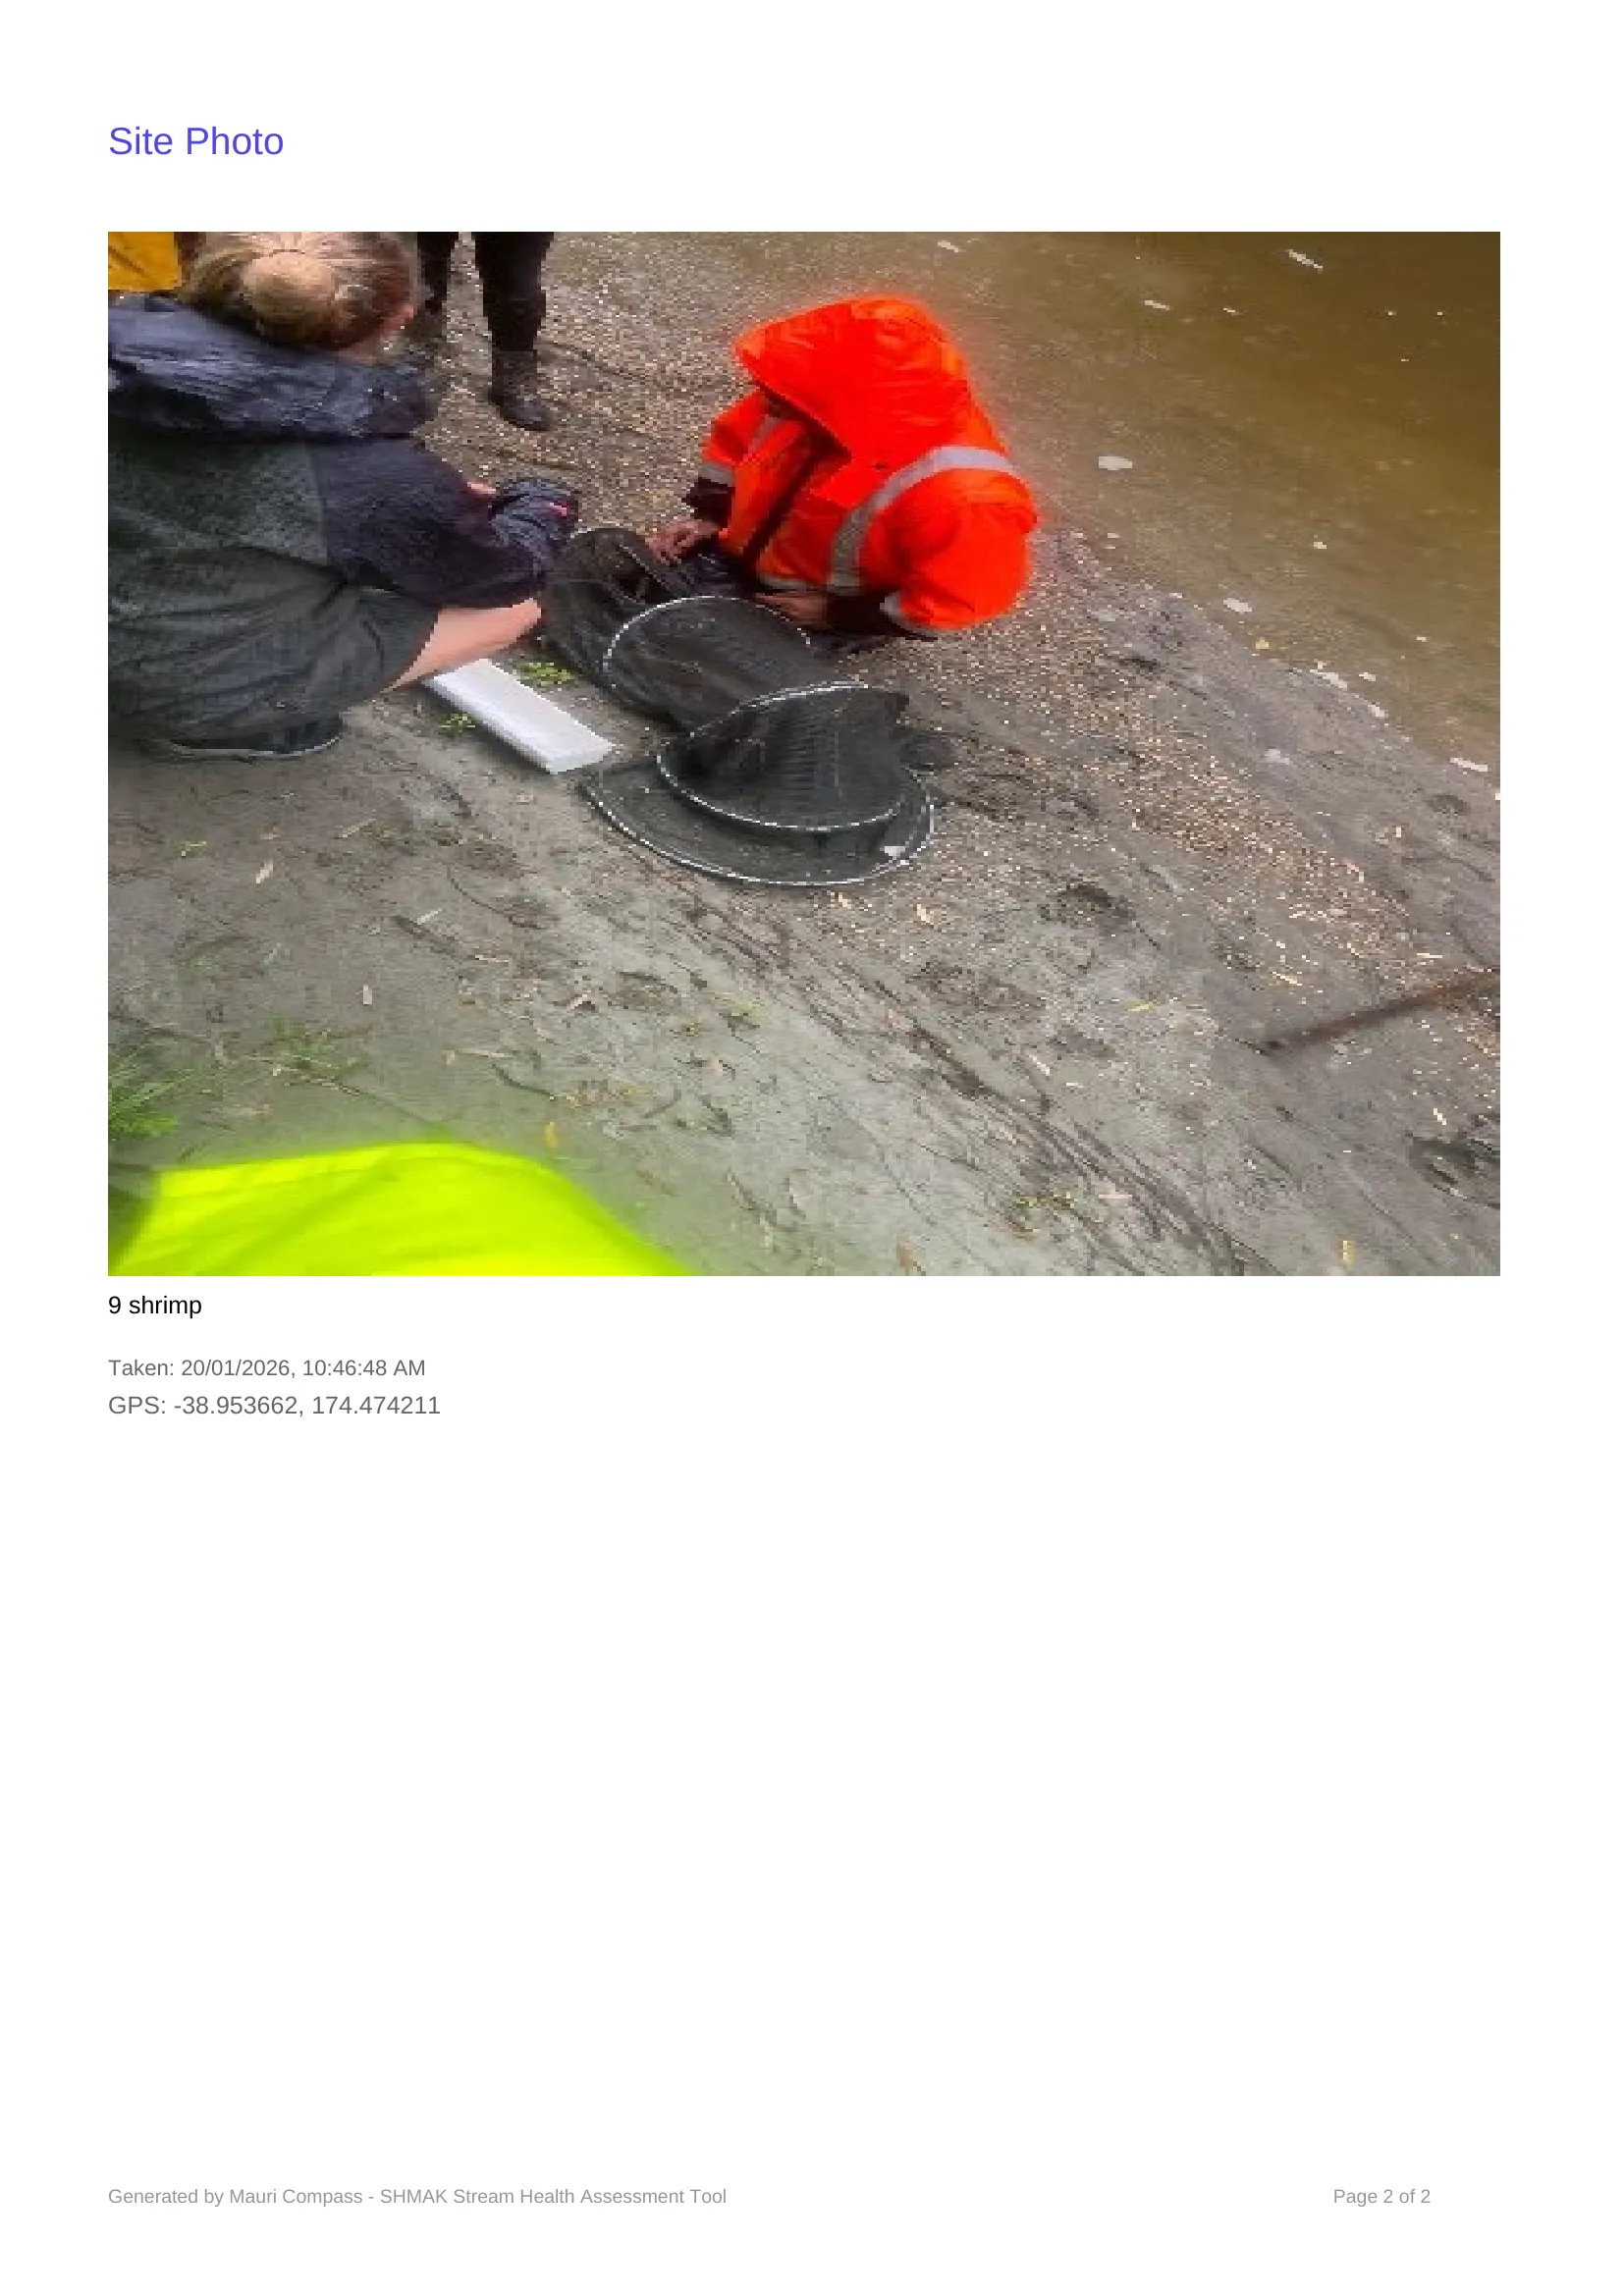
Kahu's Net
9 shrimps observed
2Mangamaio(6 fish species, 1 invertebrate types)
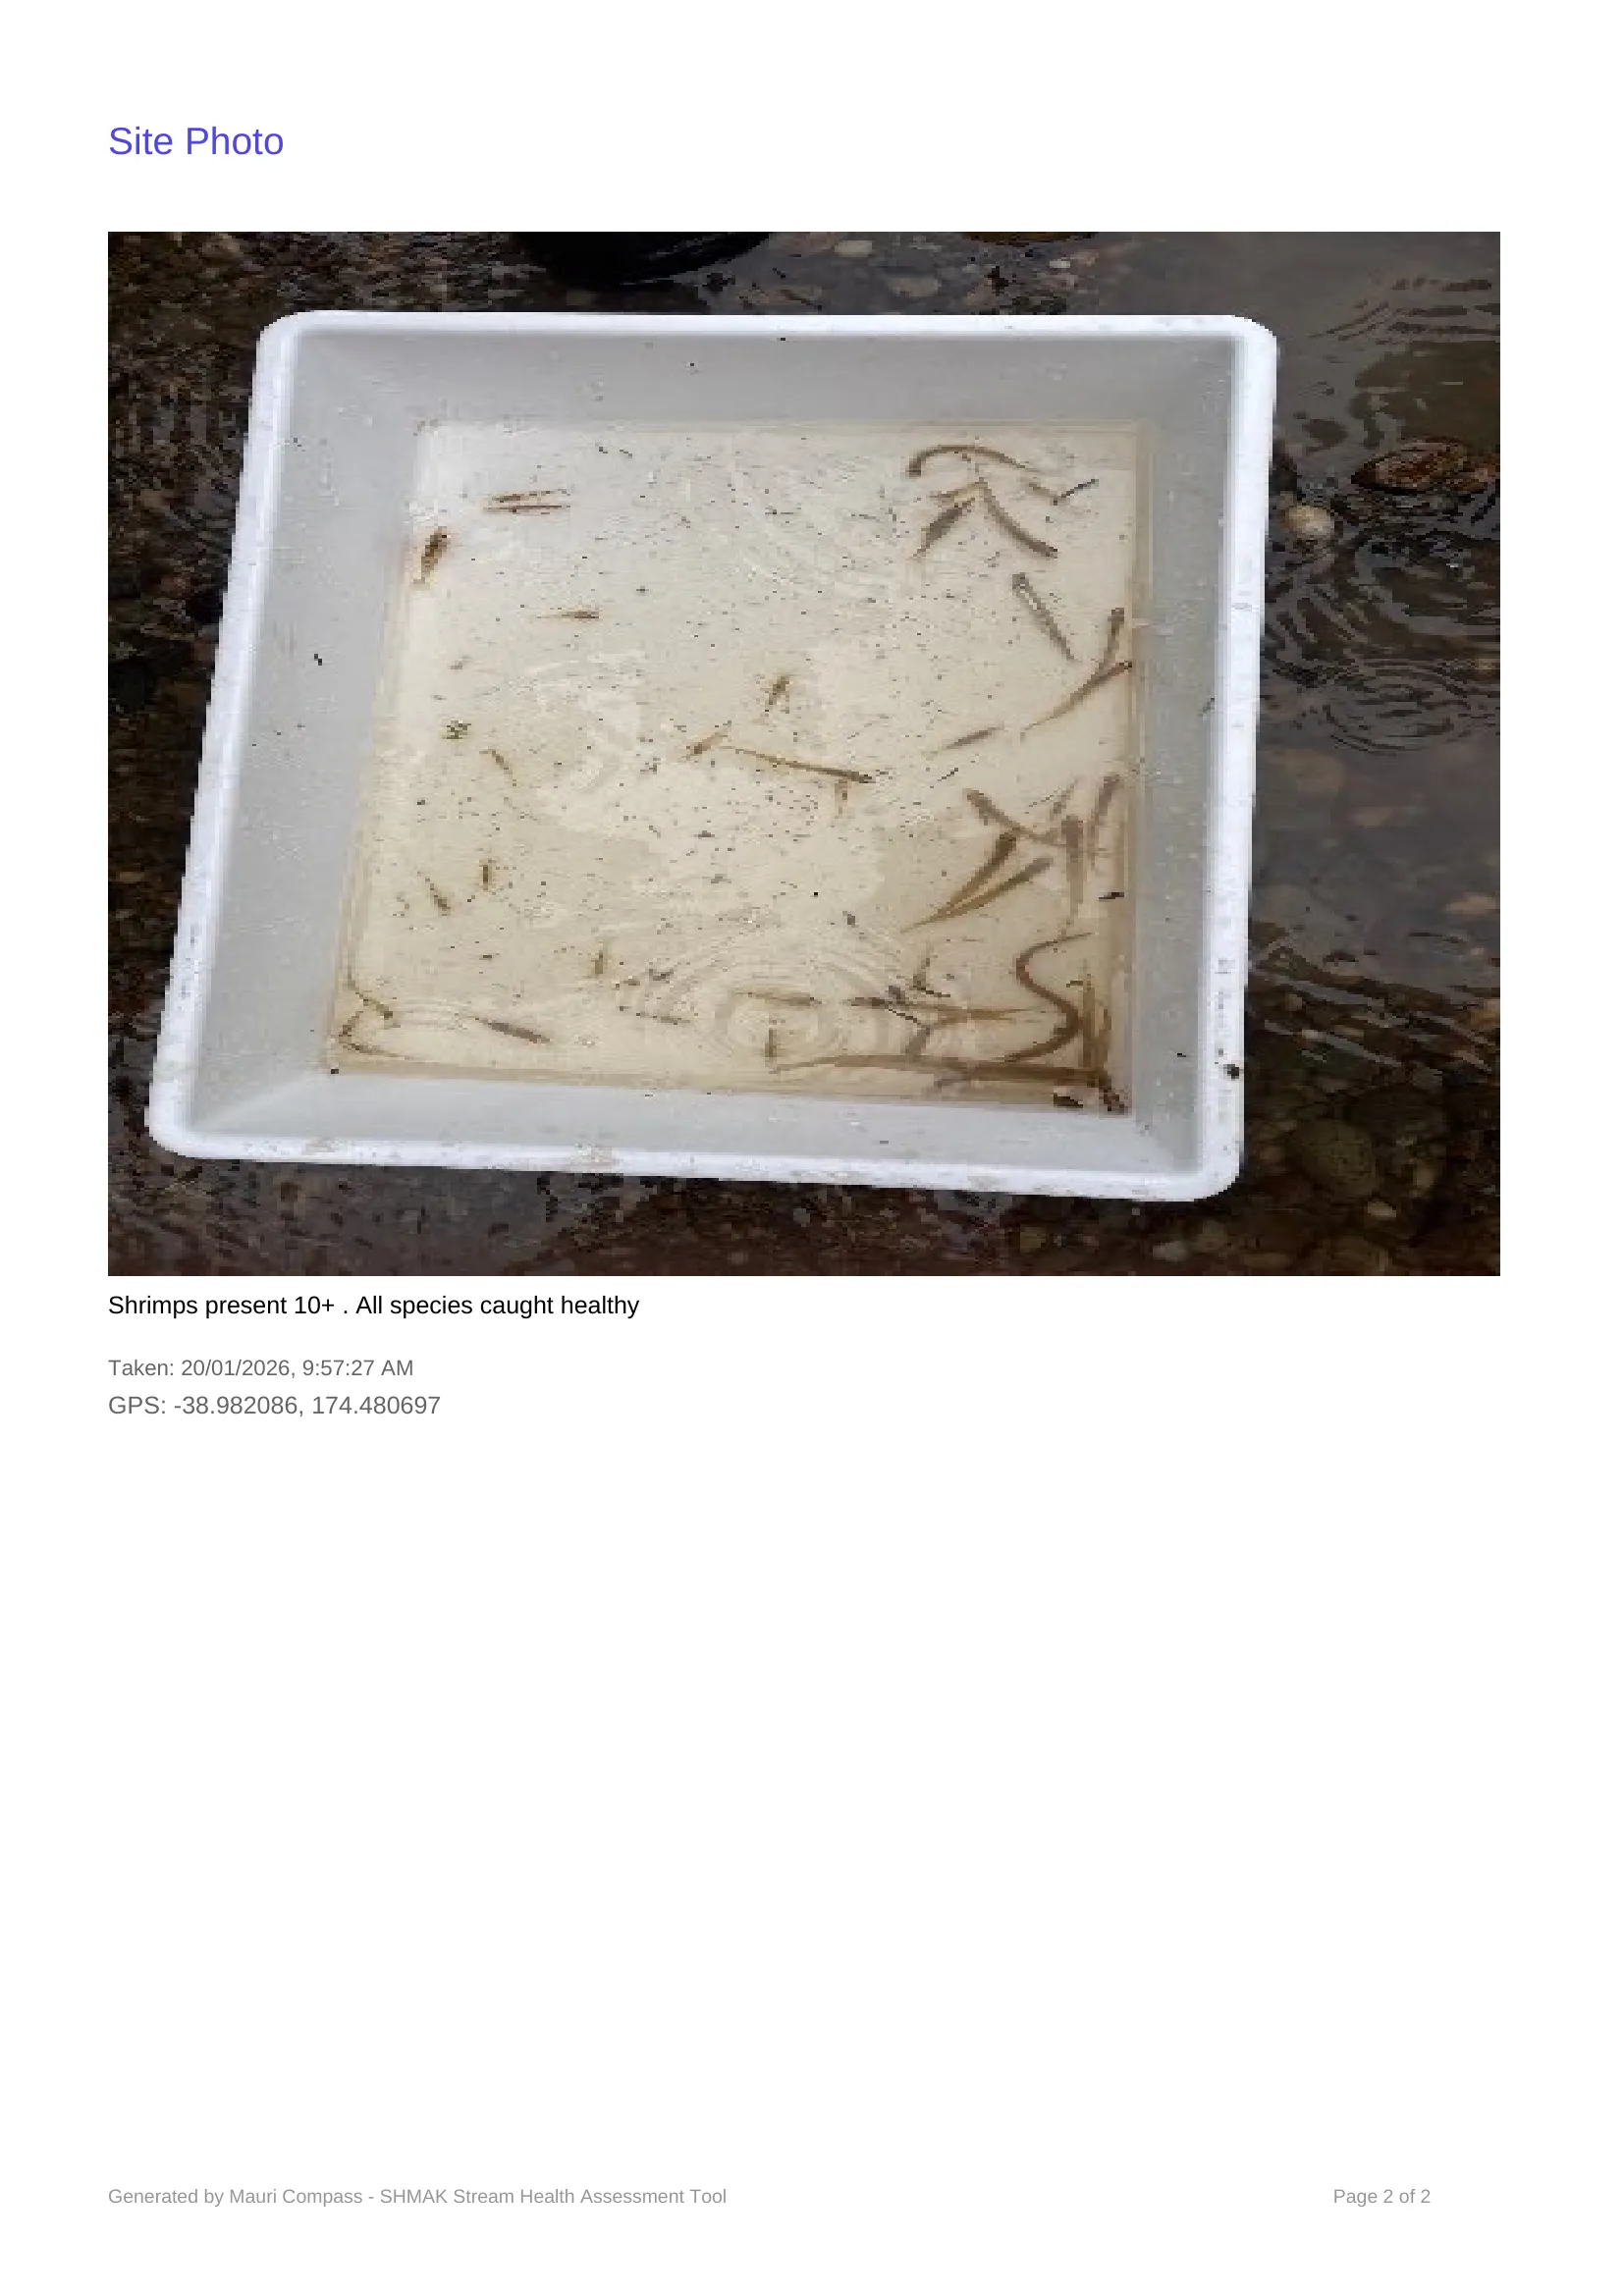
Riaki's Net
10+ shrimps, Banded Kōkopu found
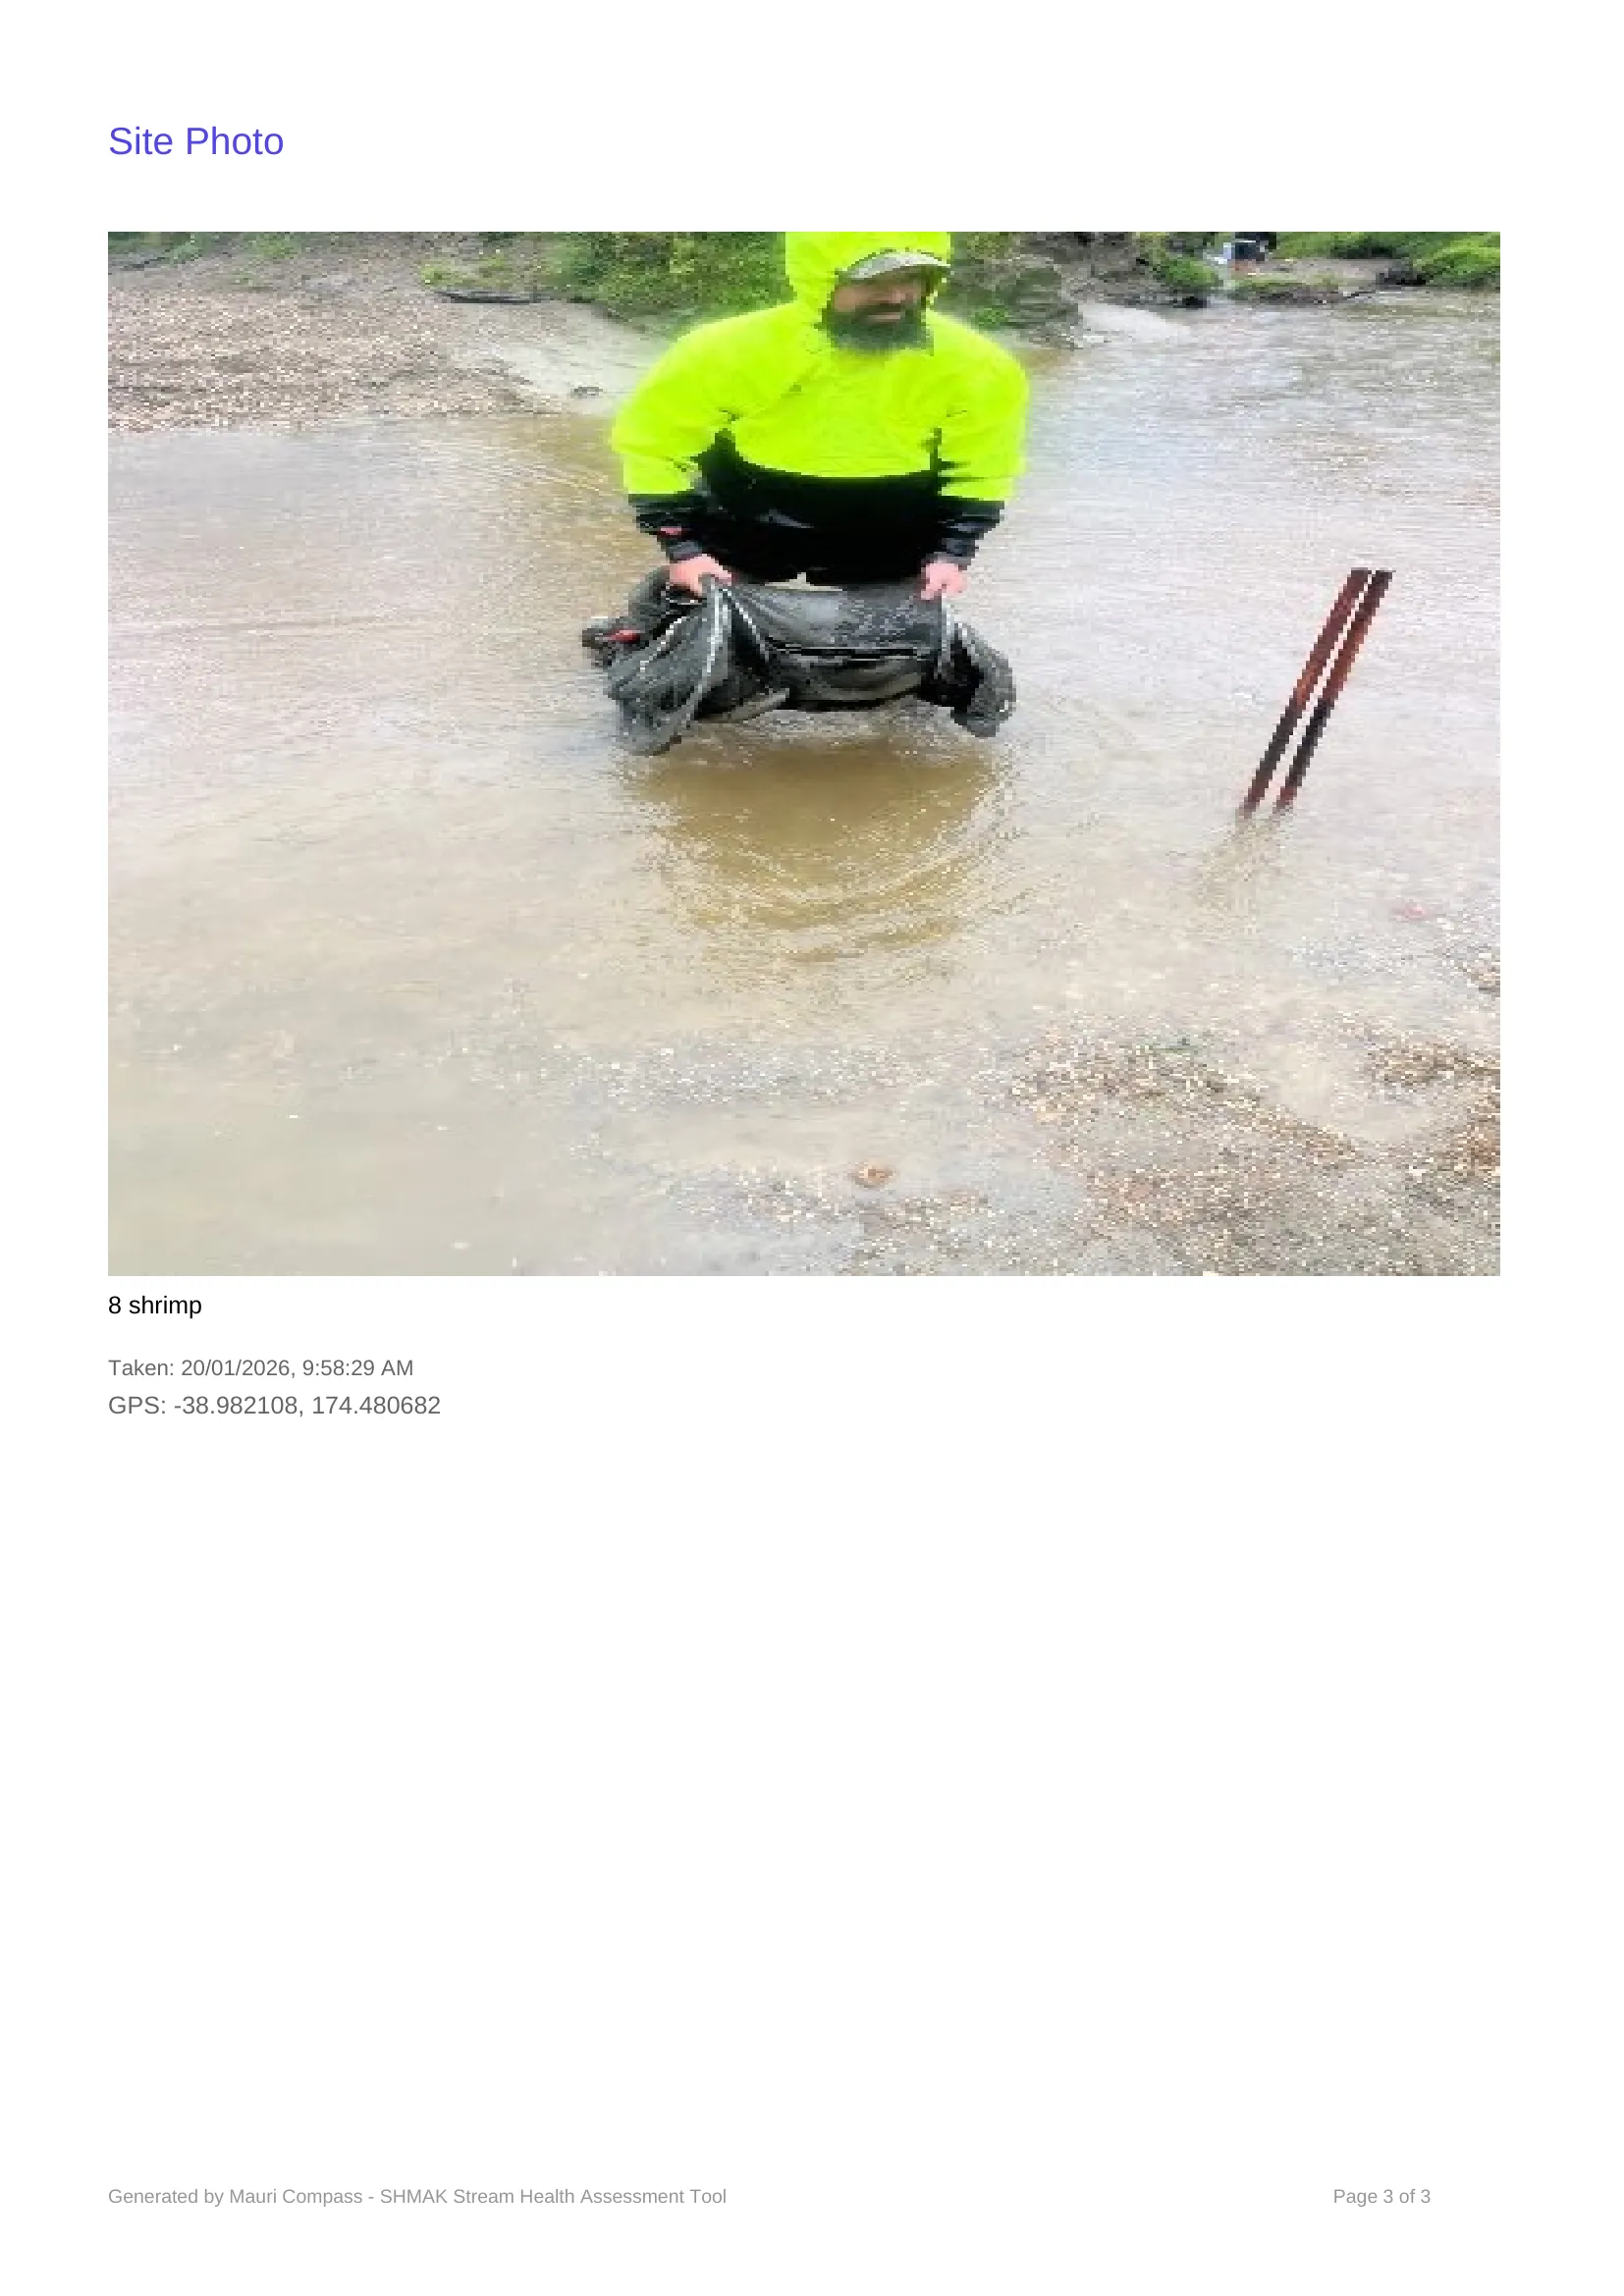
Kahu's Net
8 shrimps, 1 dead Shortfin
3Uruti Stream(3 fish species, 0 invertebrate types)
Riaki's Net
120cm large adult tuna caught
Kahu's Net
10 healthy tuna measured
4Mangahia(2 fish species, 3 invertebrate types)
Riaki's Net
14 tuna from upstream net
Kahu's Net
2 tuna + 2 elvers, mayflies, damselflies
8Mangamatou(1 fish species, 1 invertebrate types)
Riaki's Net
6 tuna from downstream, shrimps present
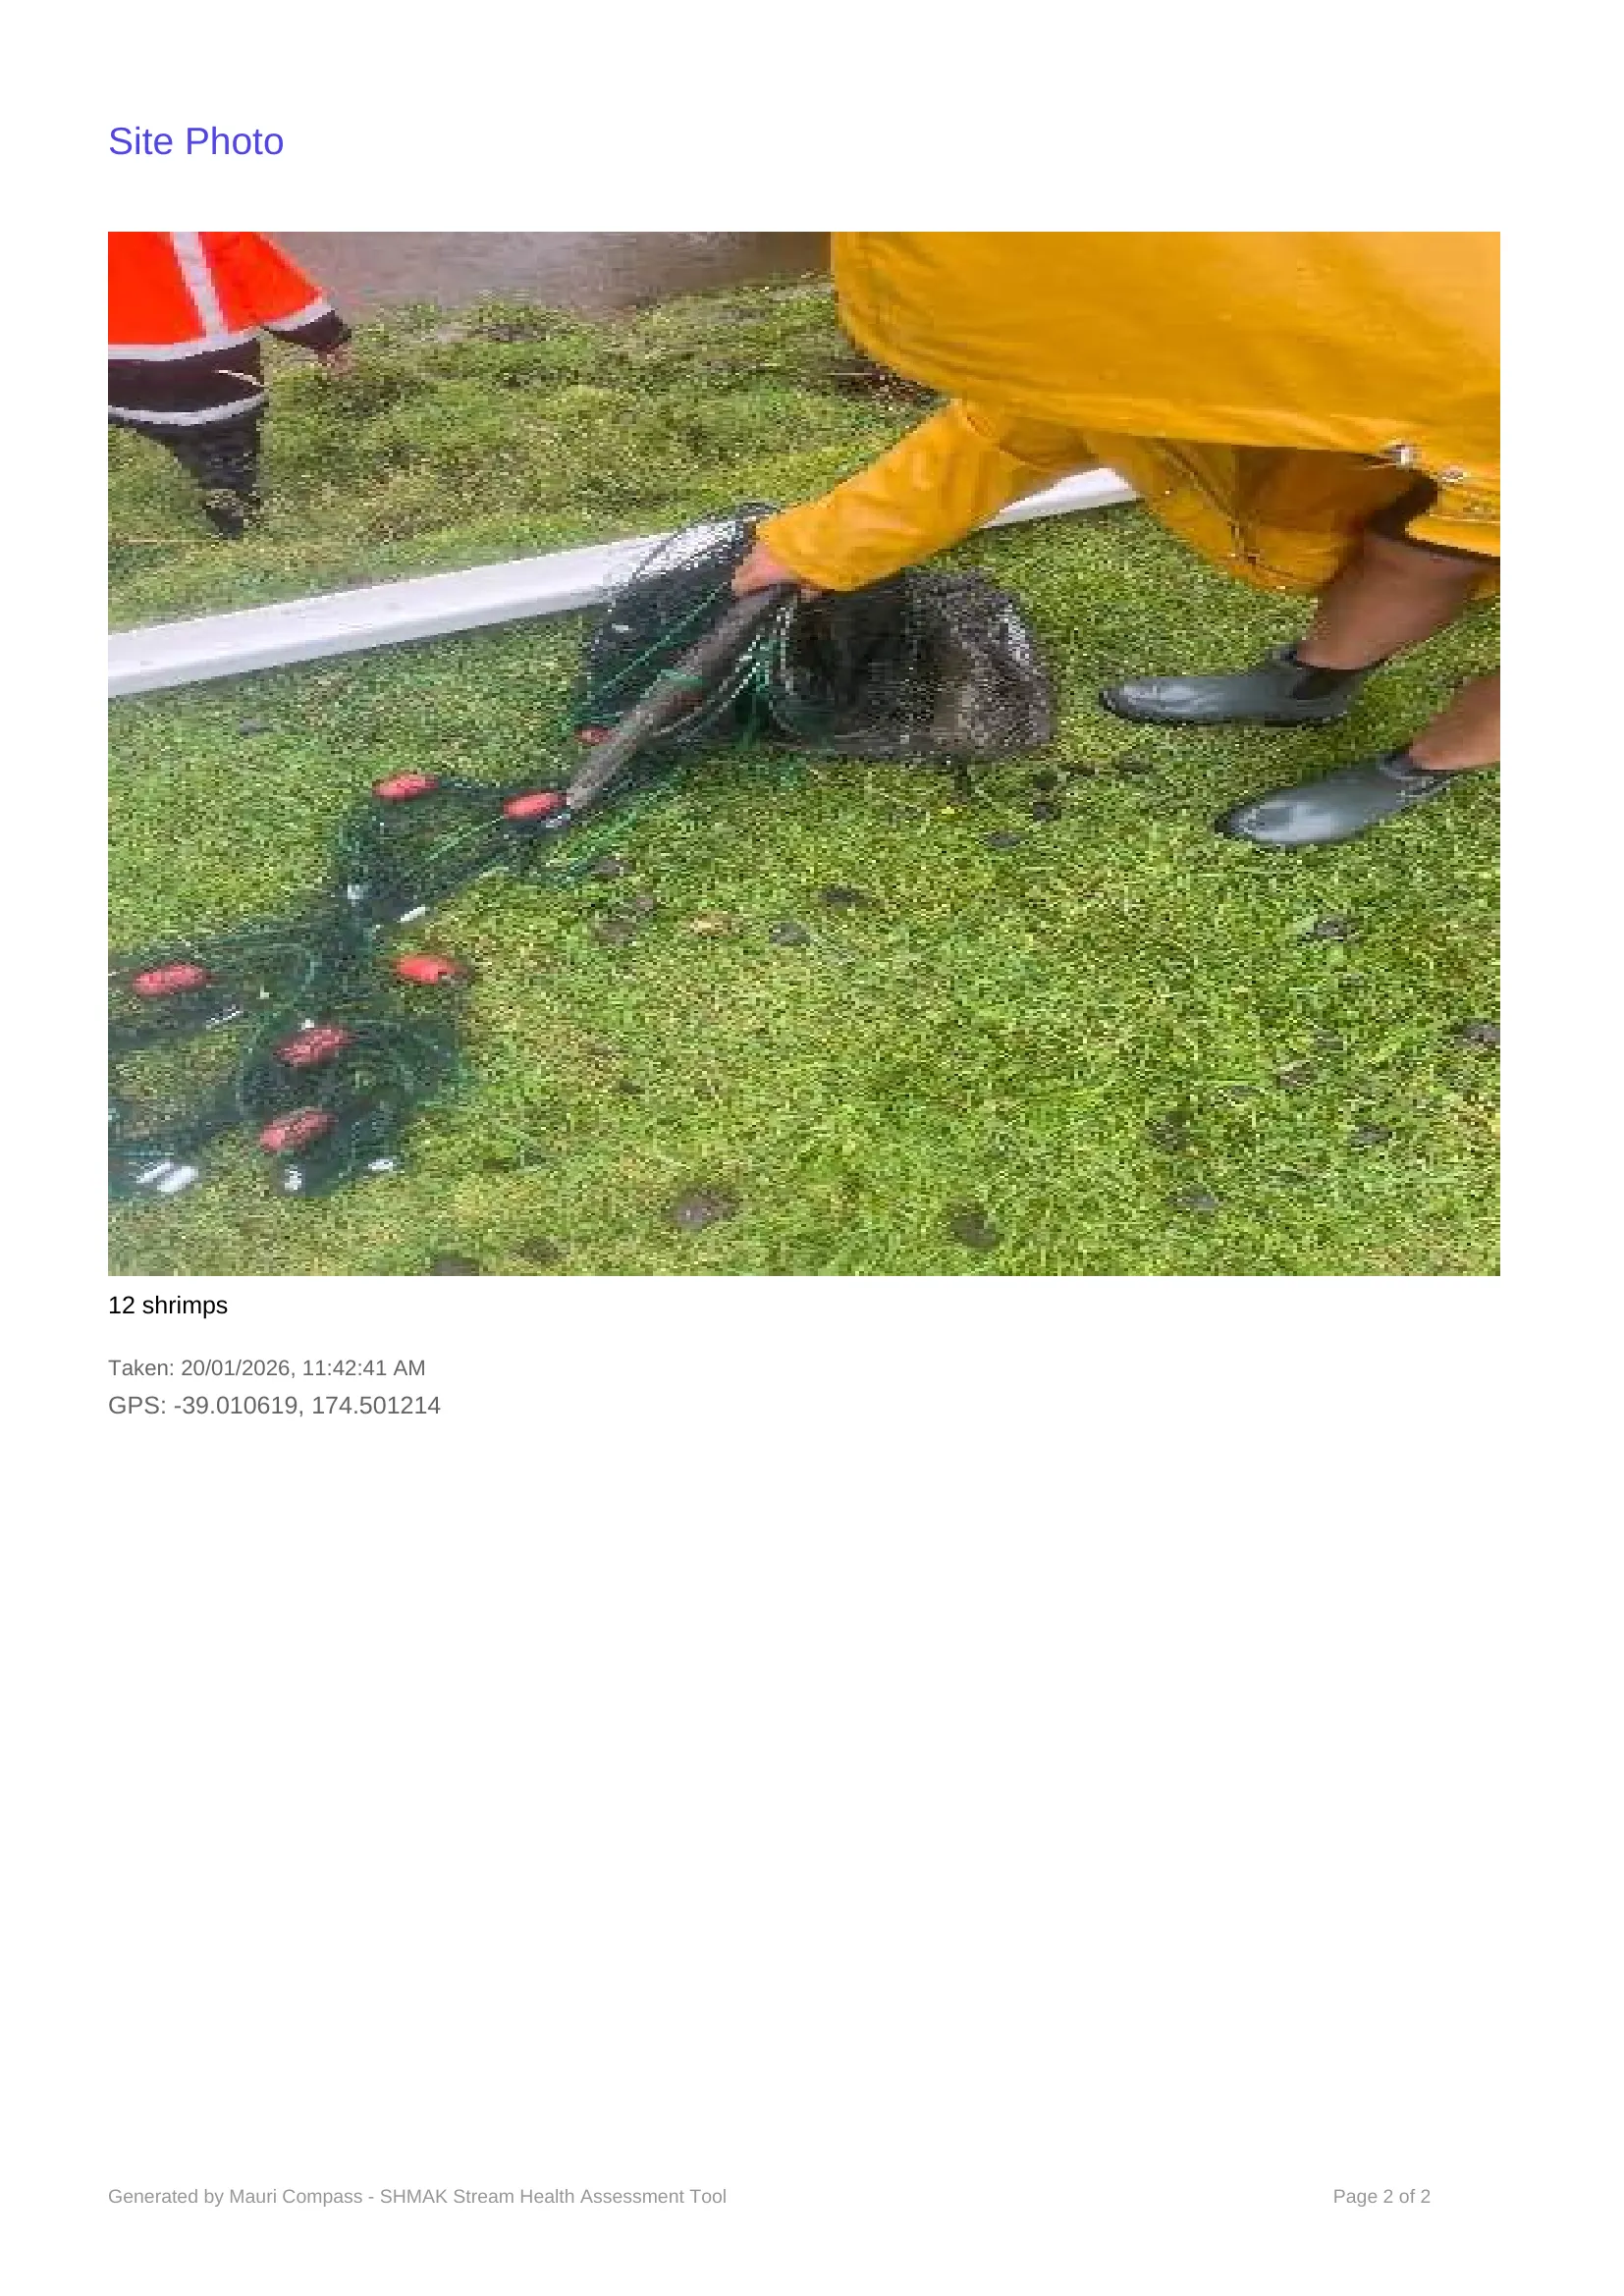
Kahu's Net
5 tuna from upstream, 12 shrimps
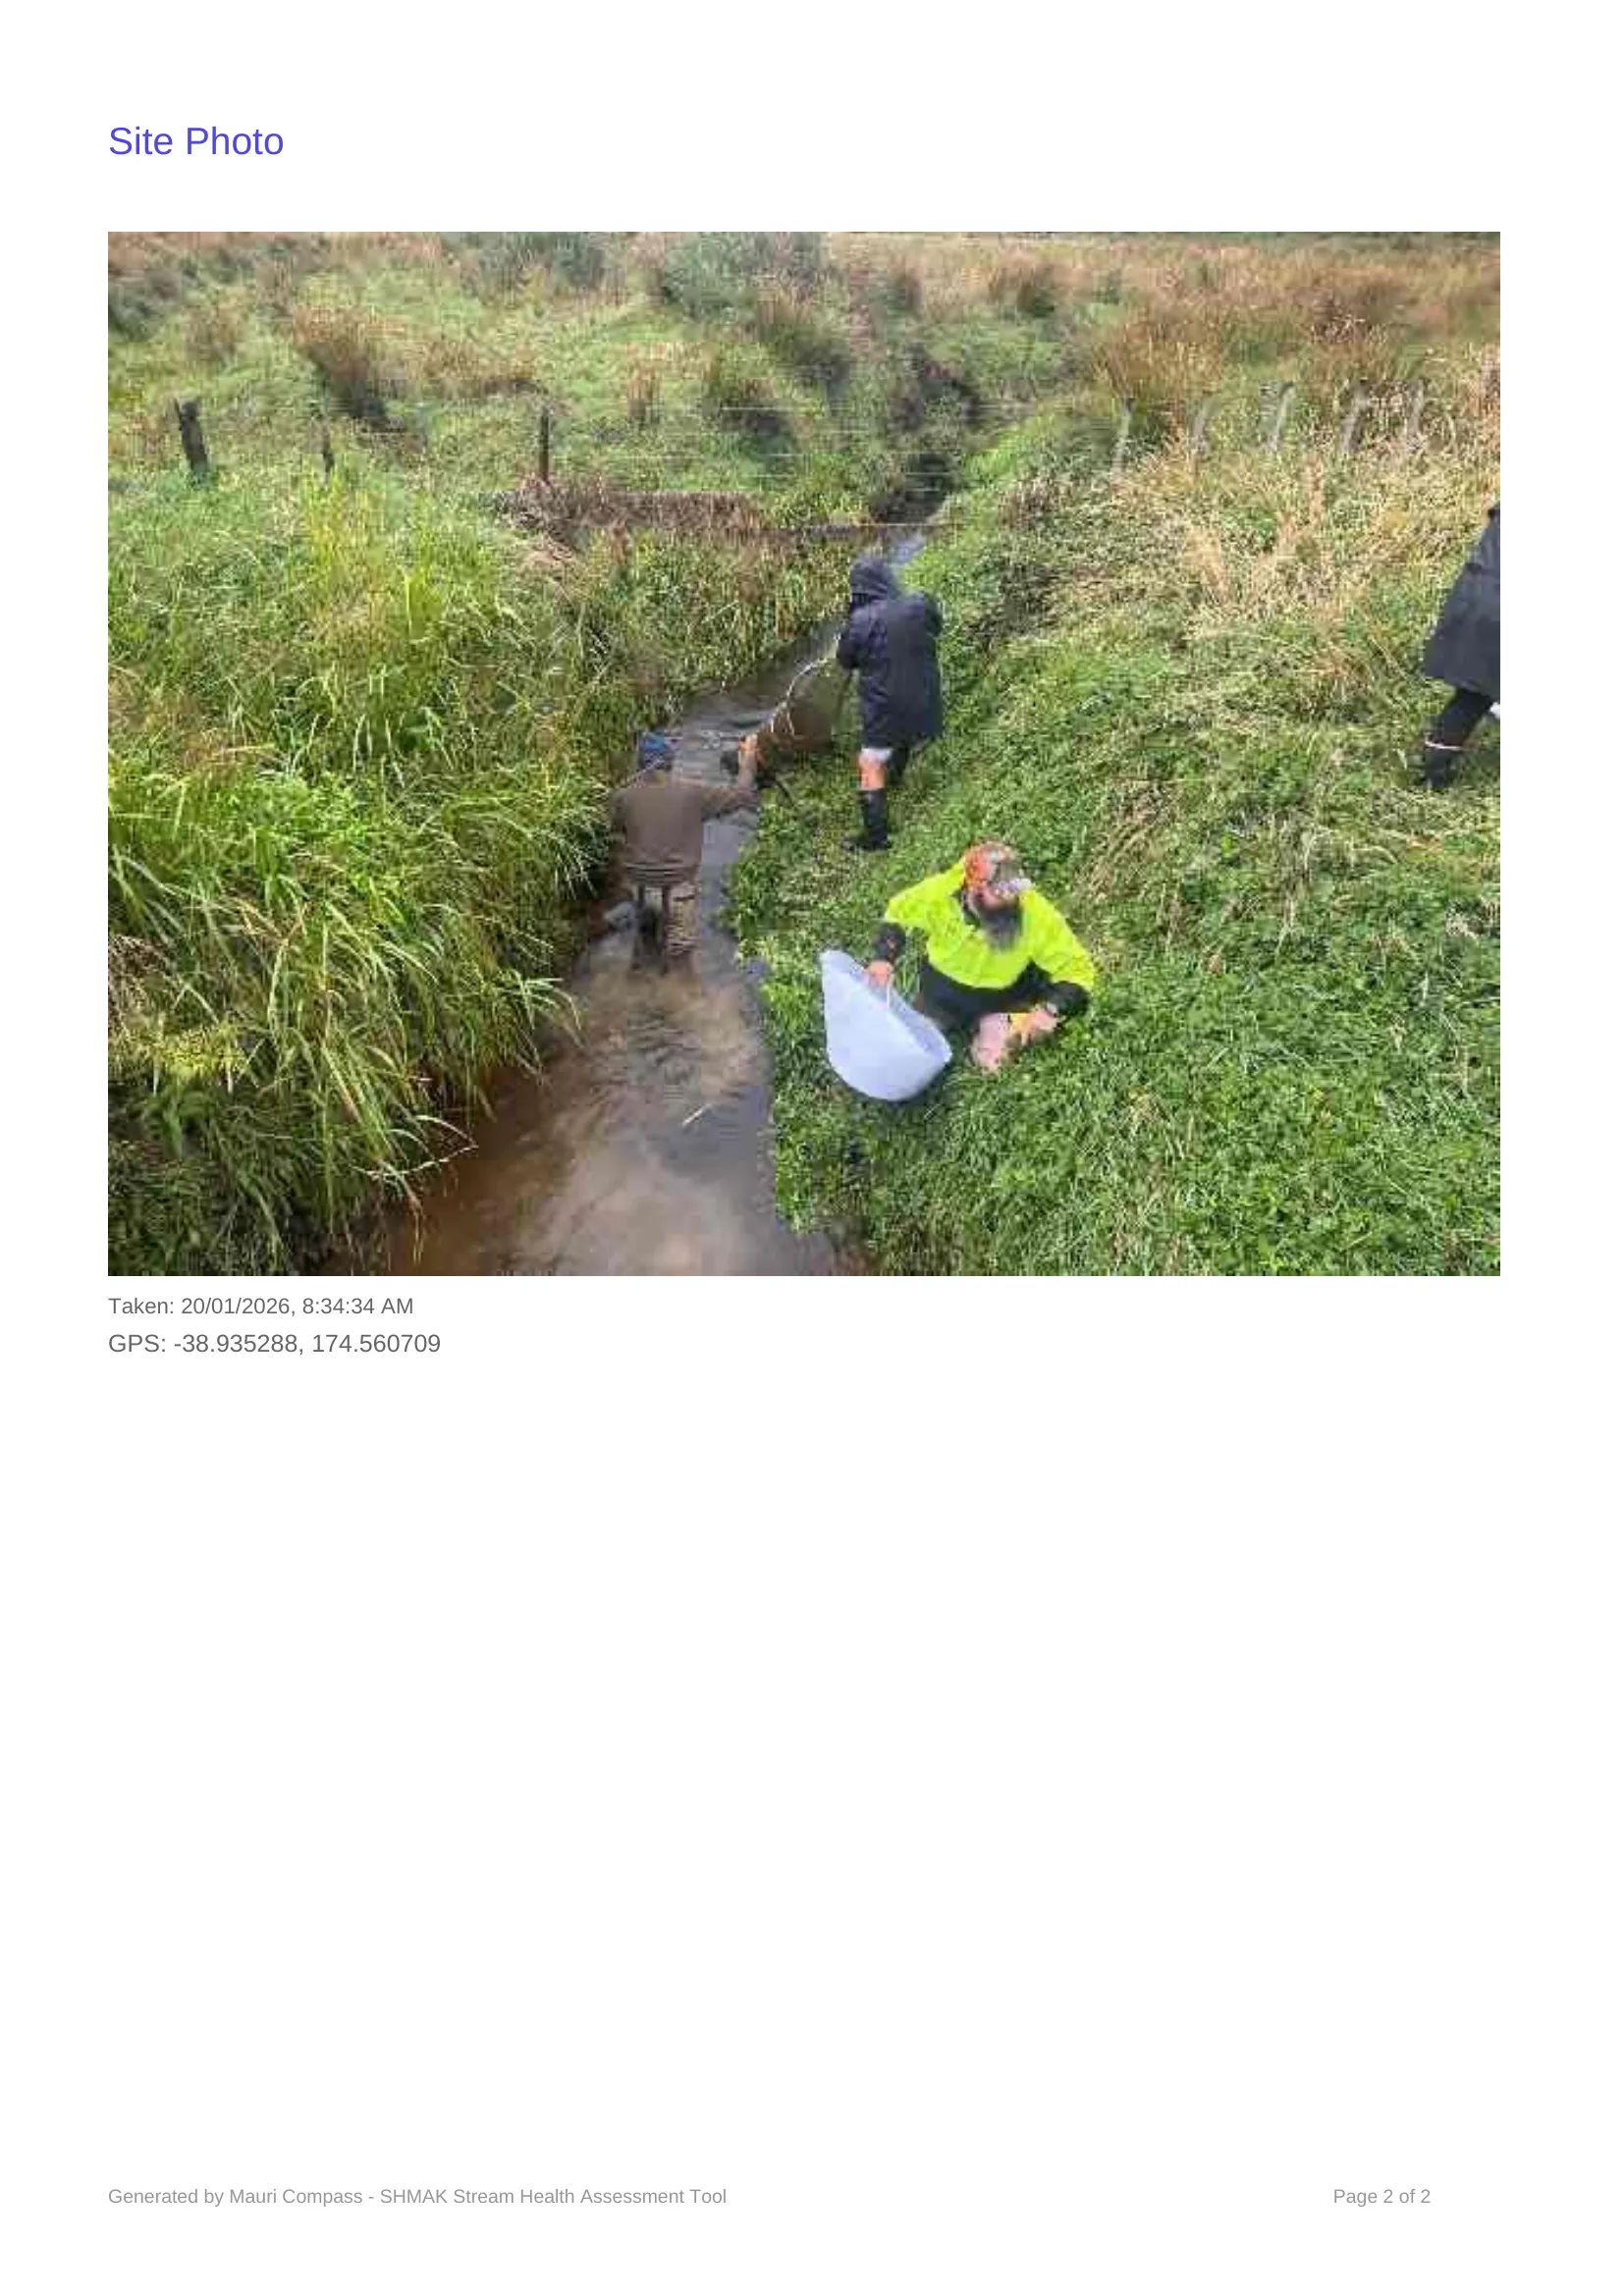
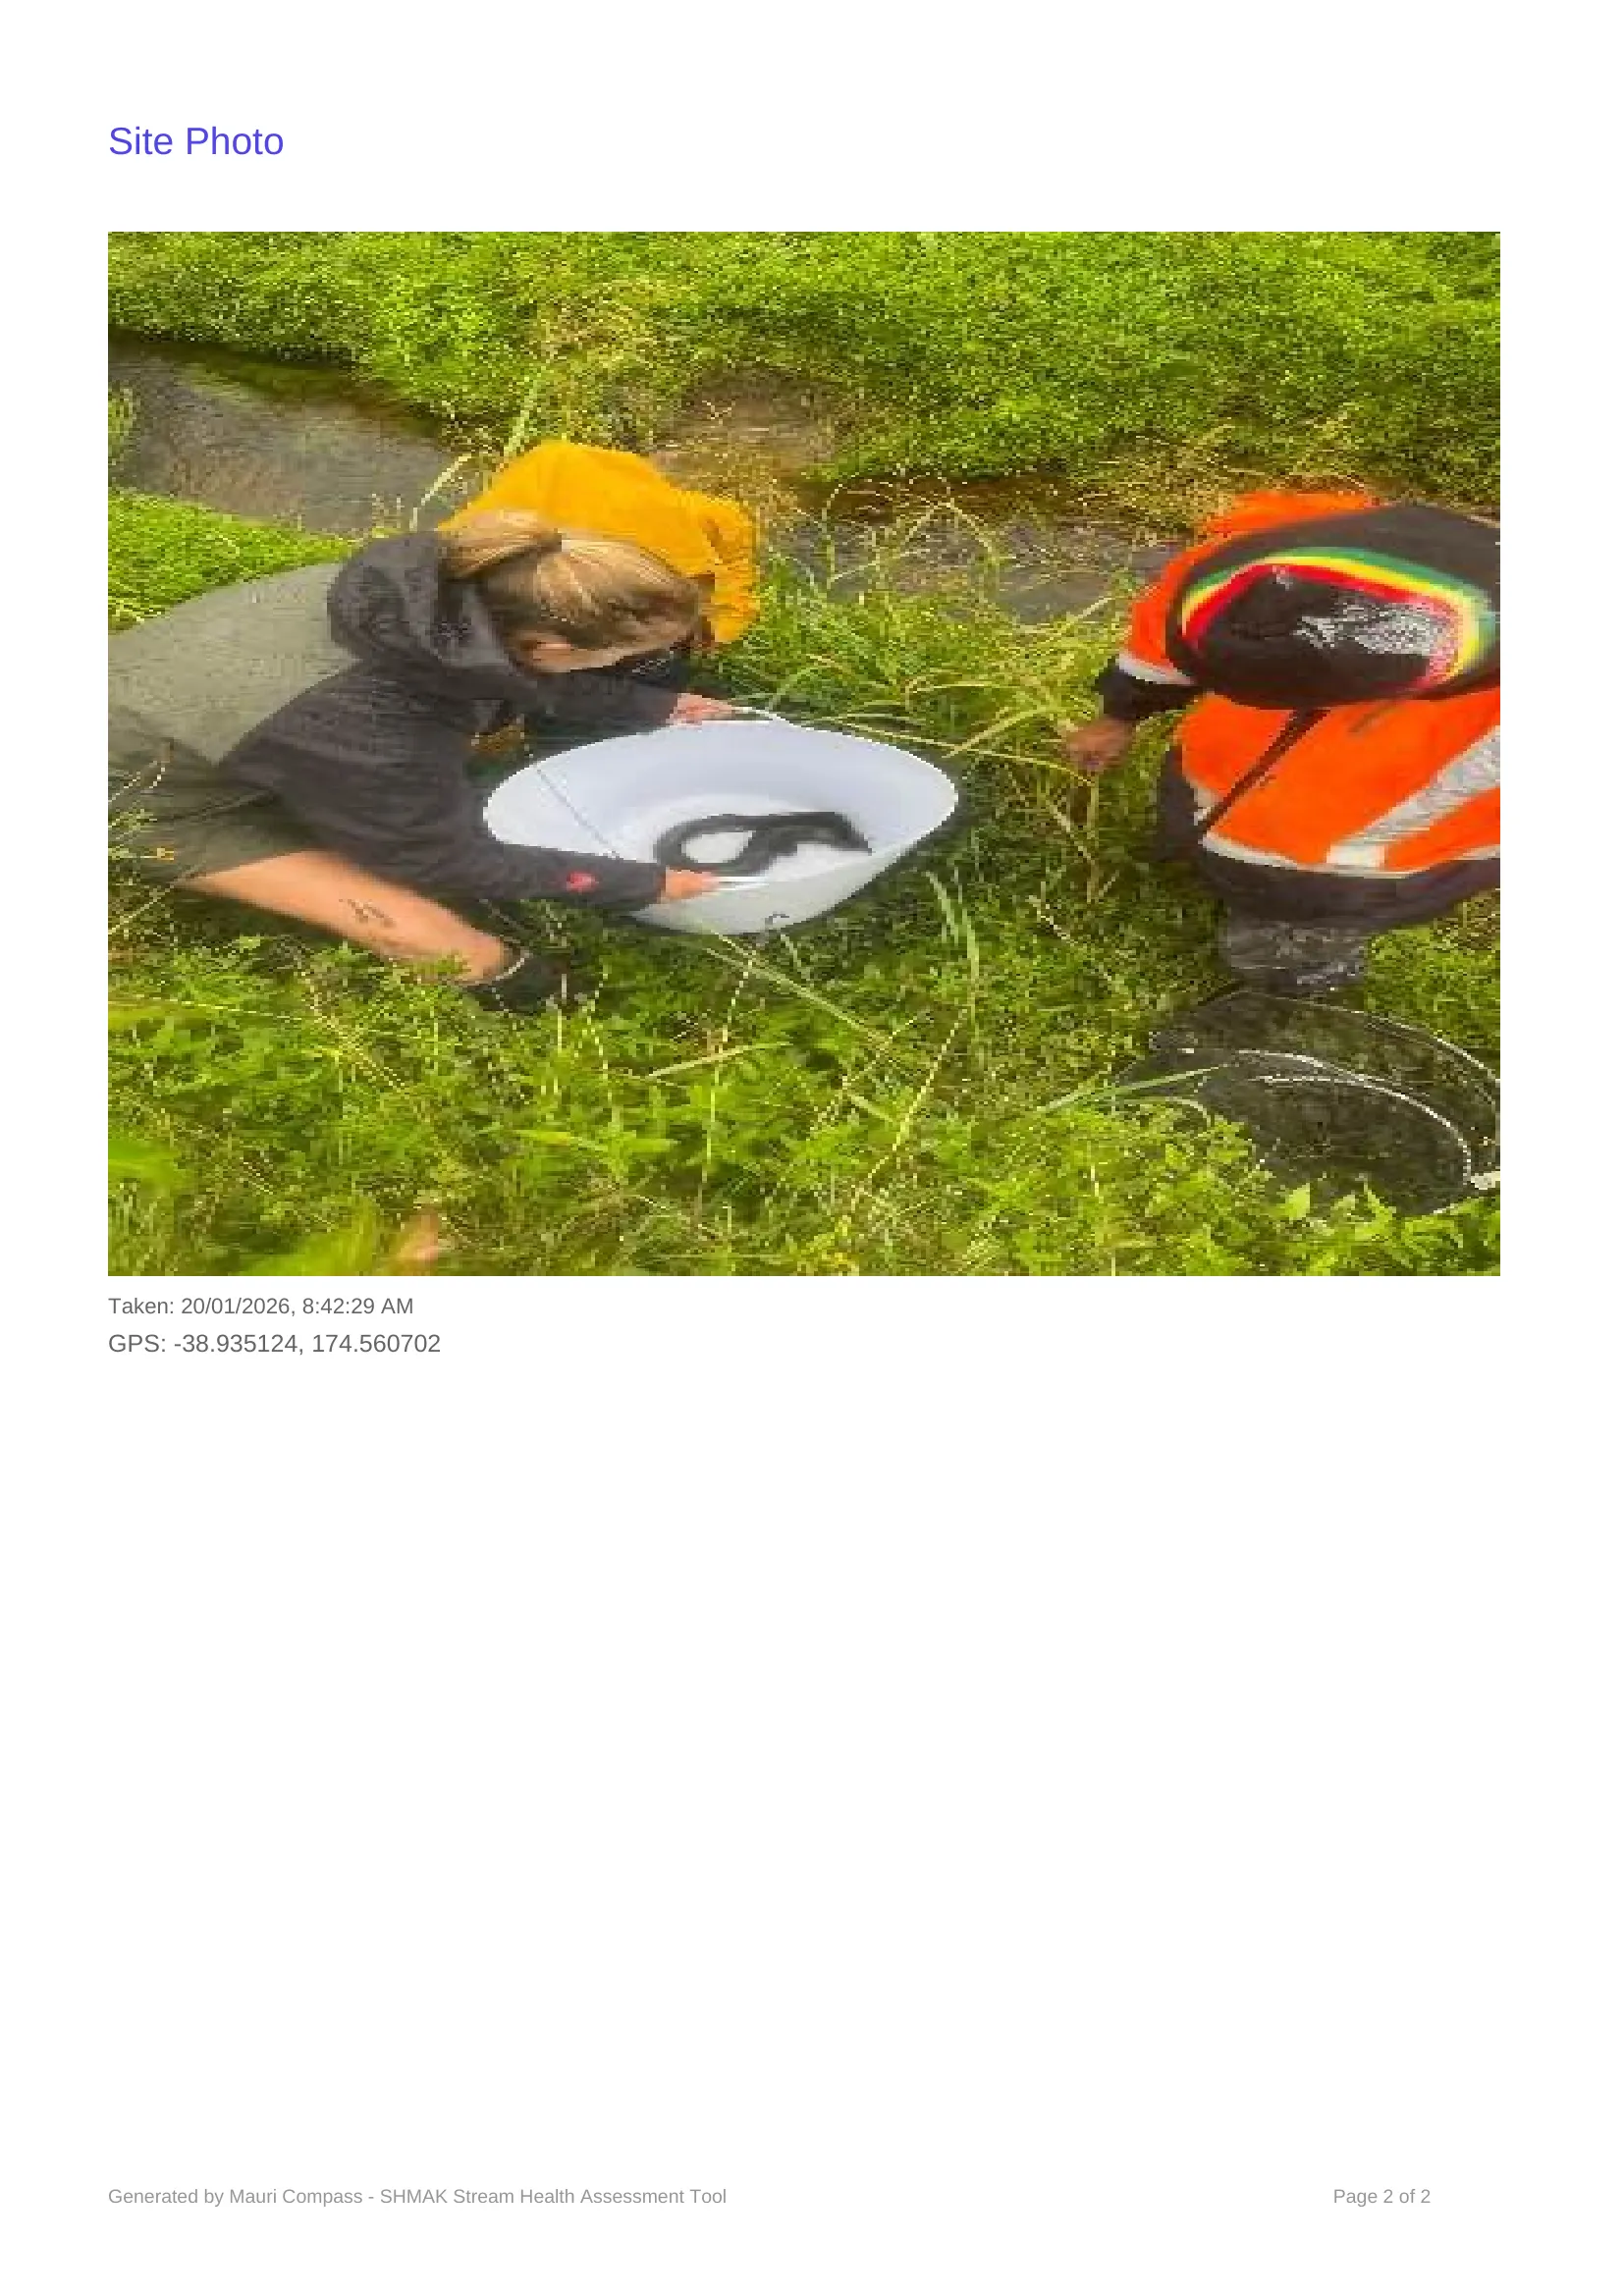
Field Work Gallery
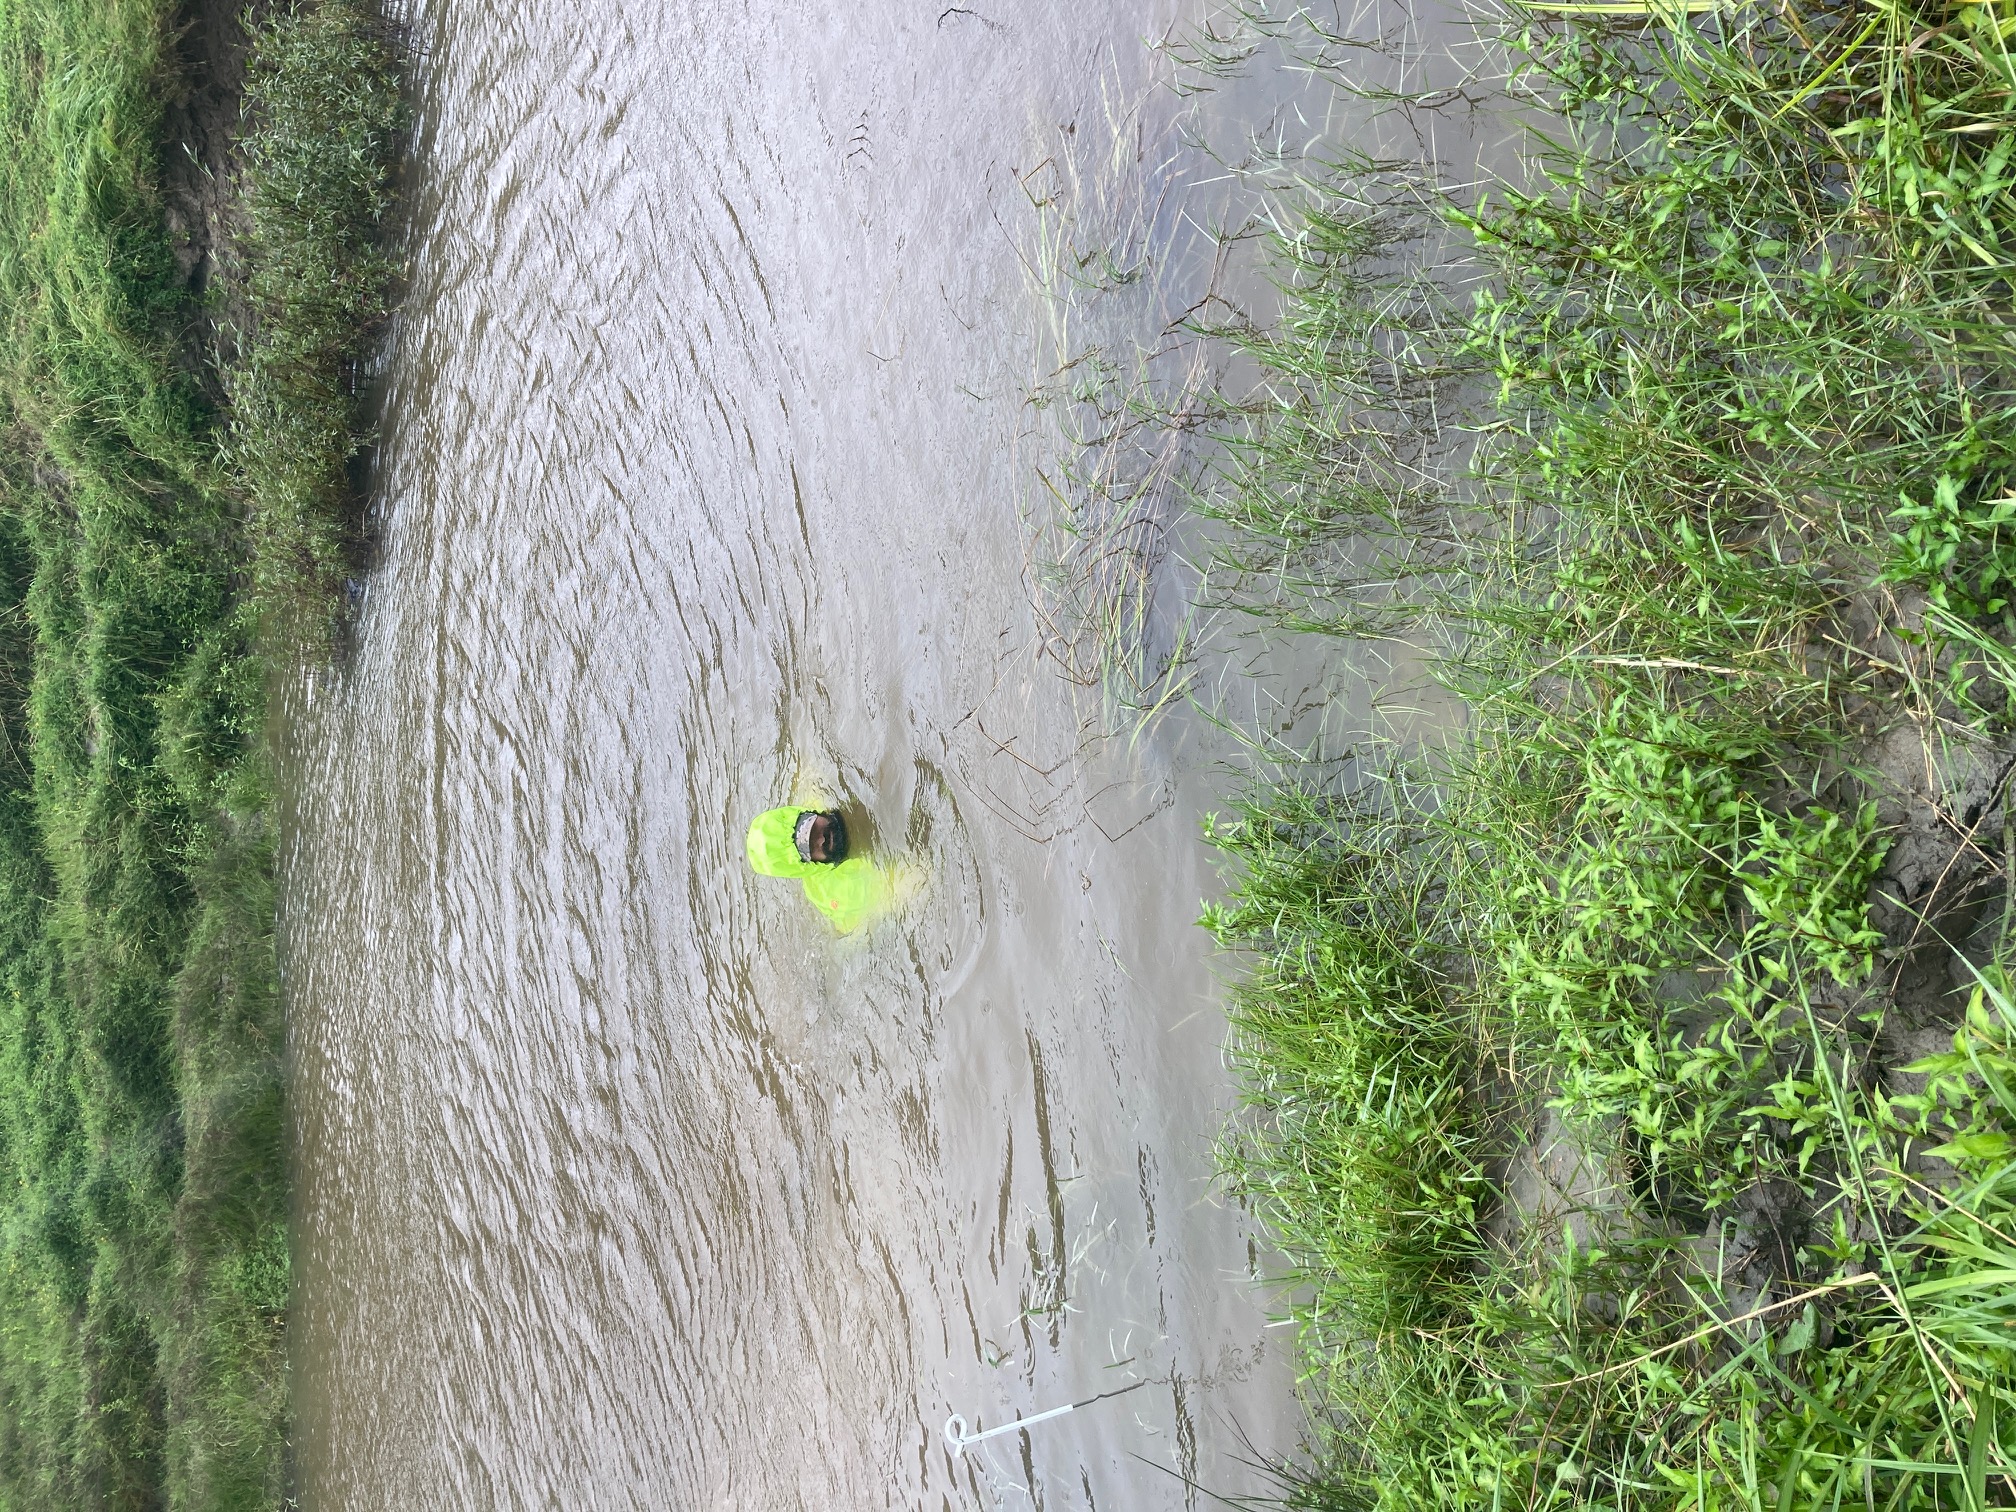
Deep Water Sampling
Checking fyke nets in deeper pools
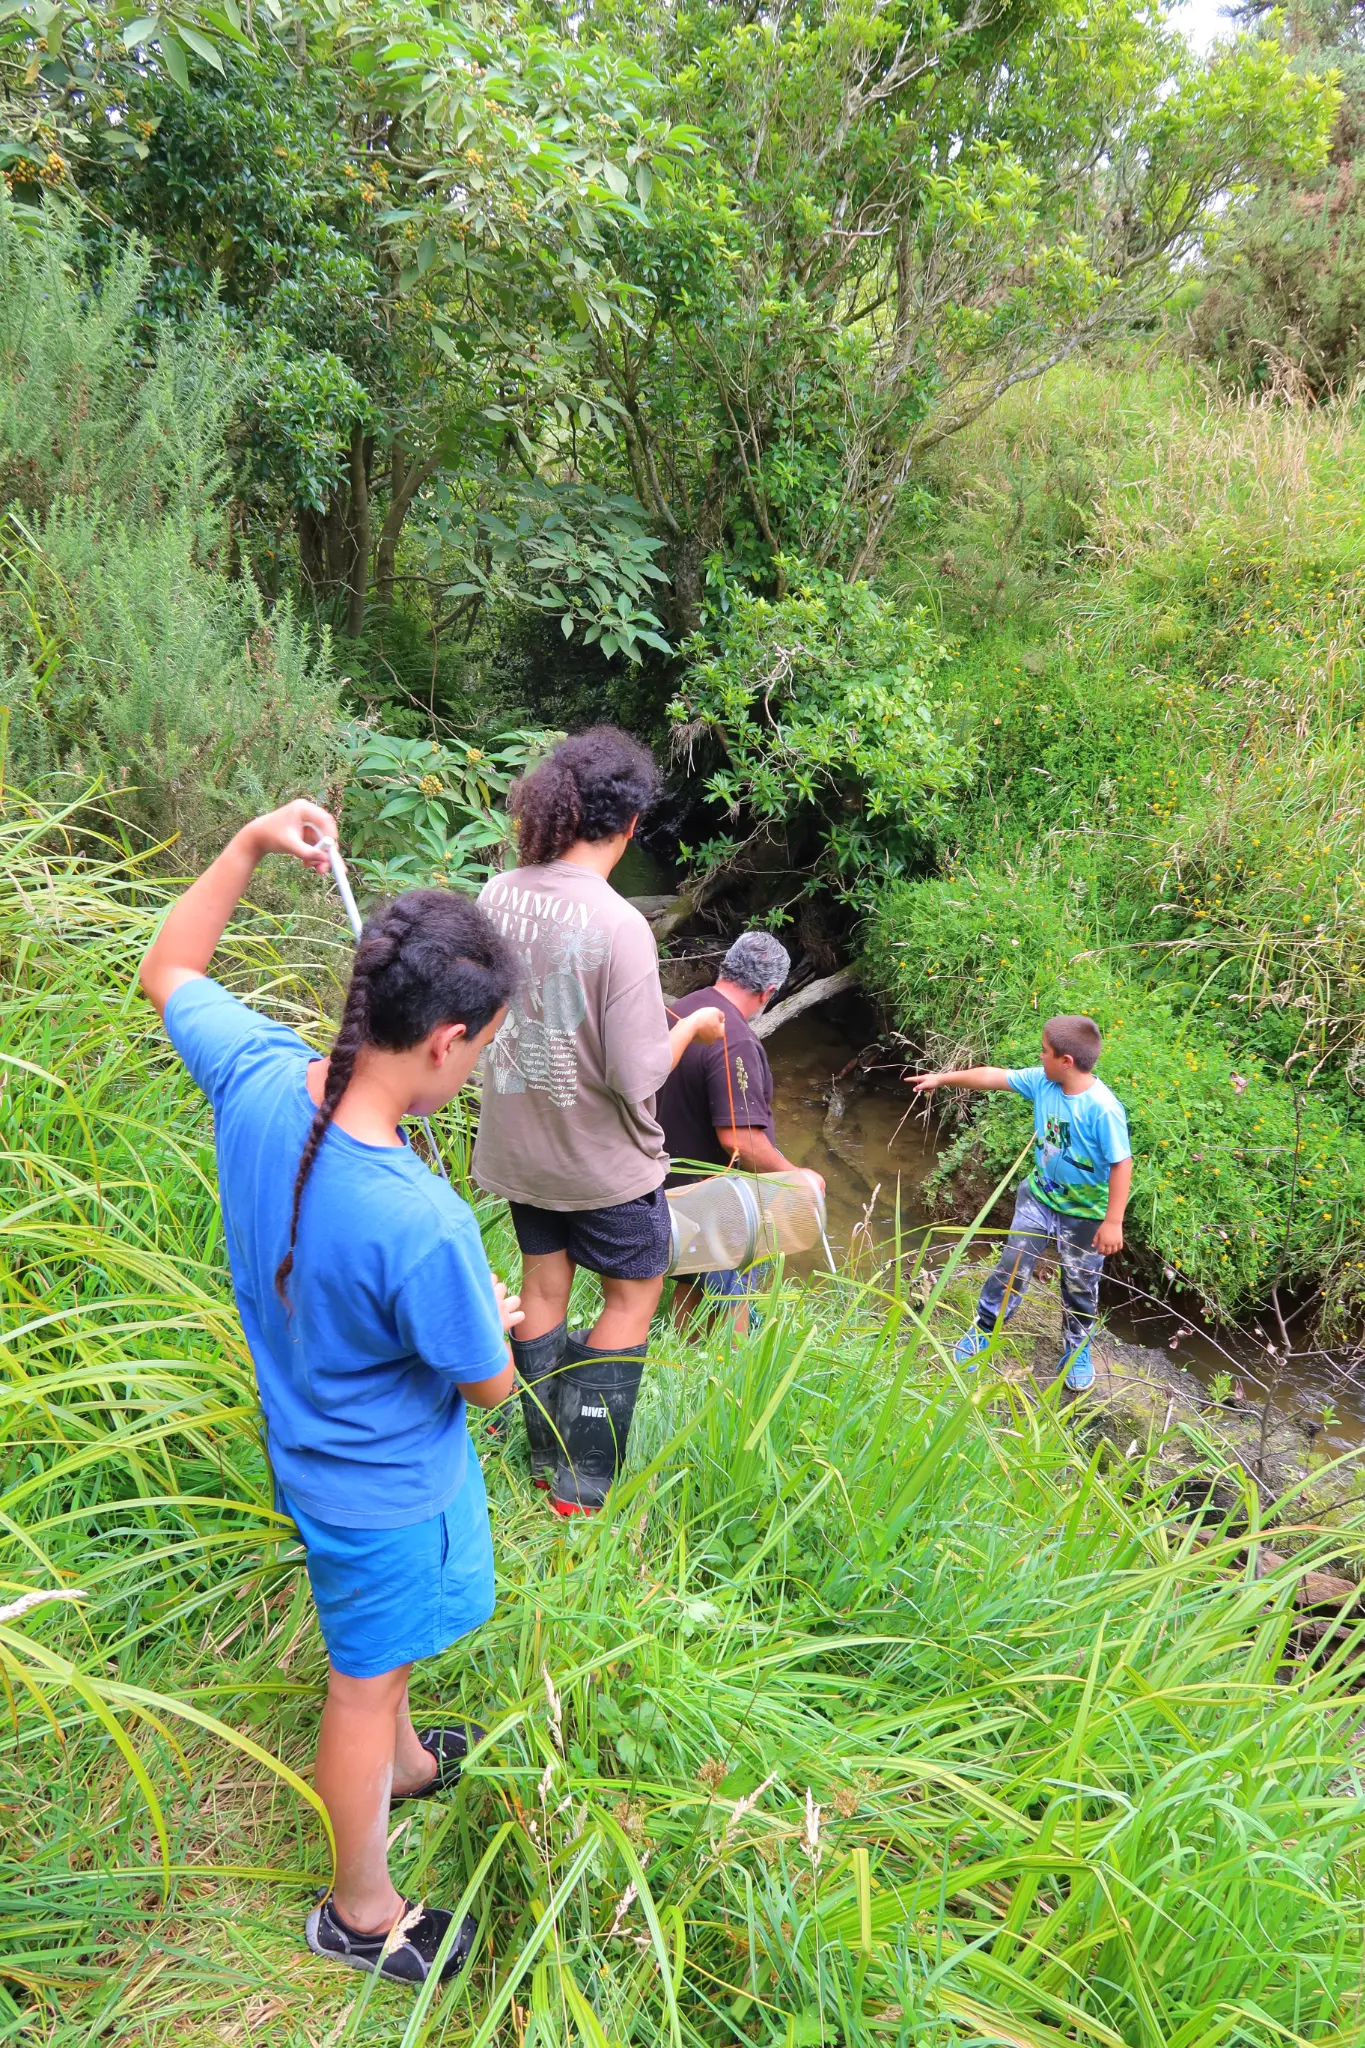
Mangahia Stream
Rangatahi deploying G-minnow traps
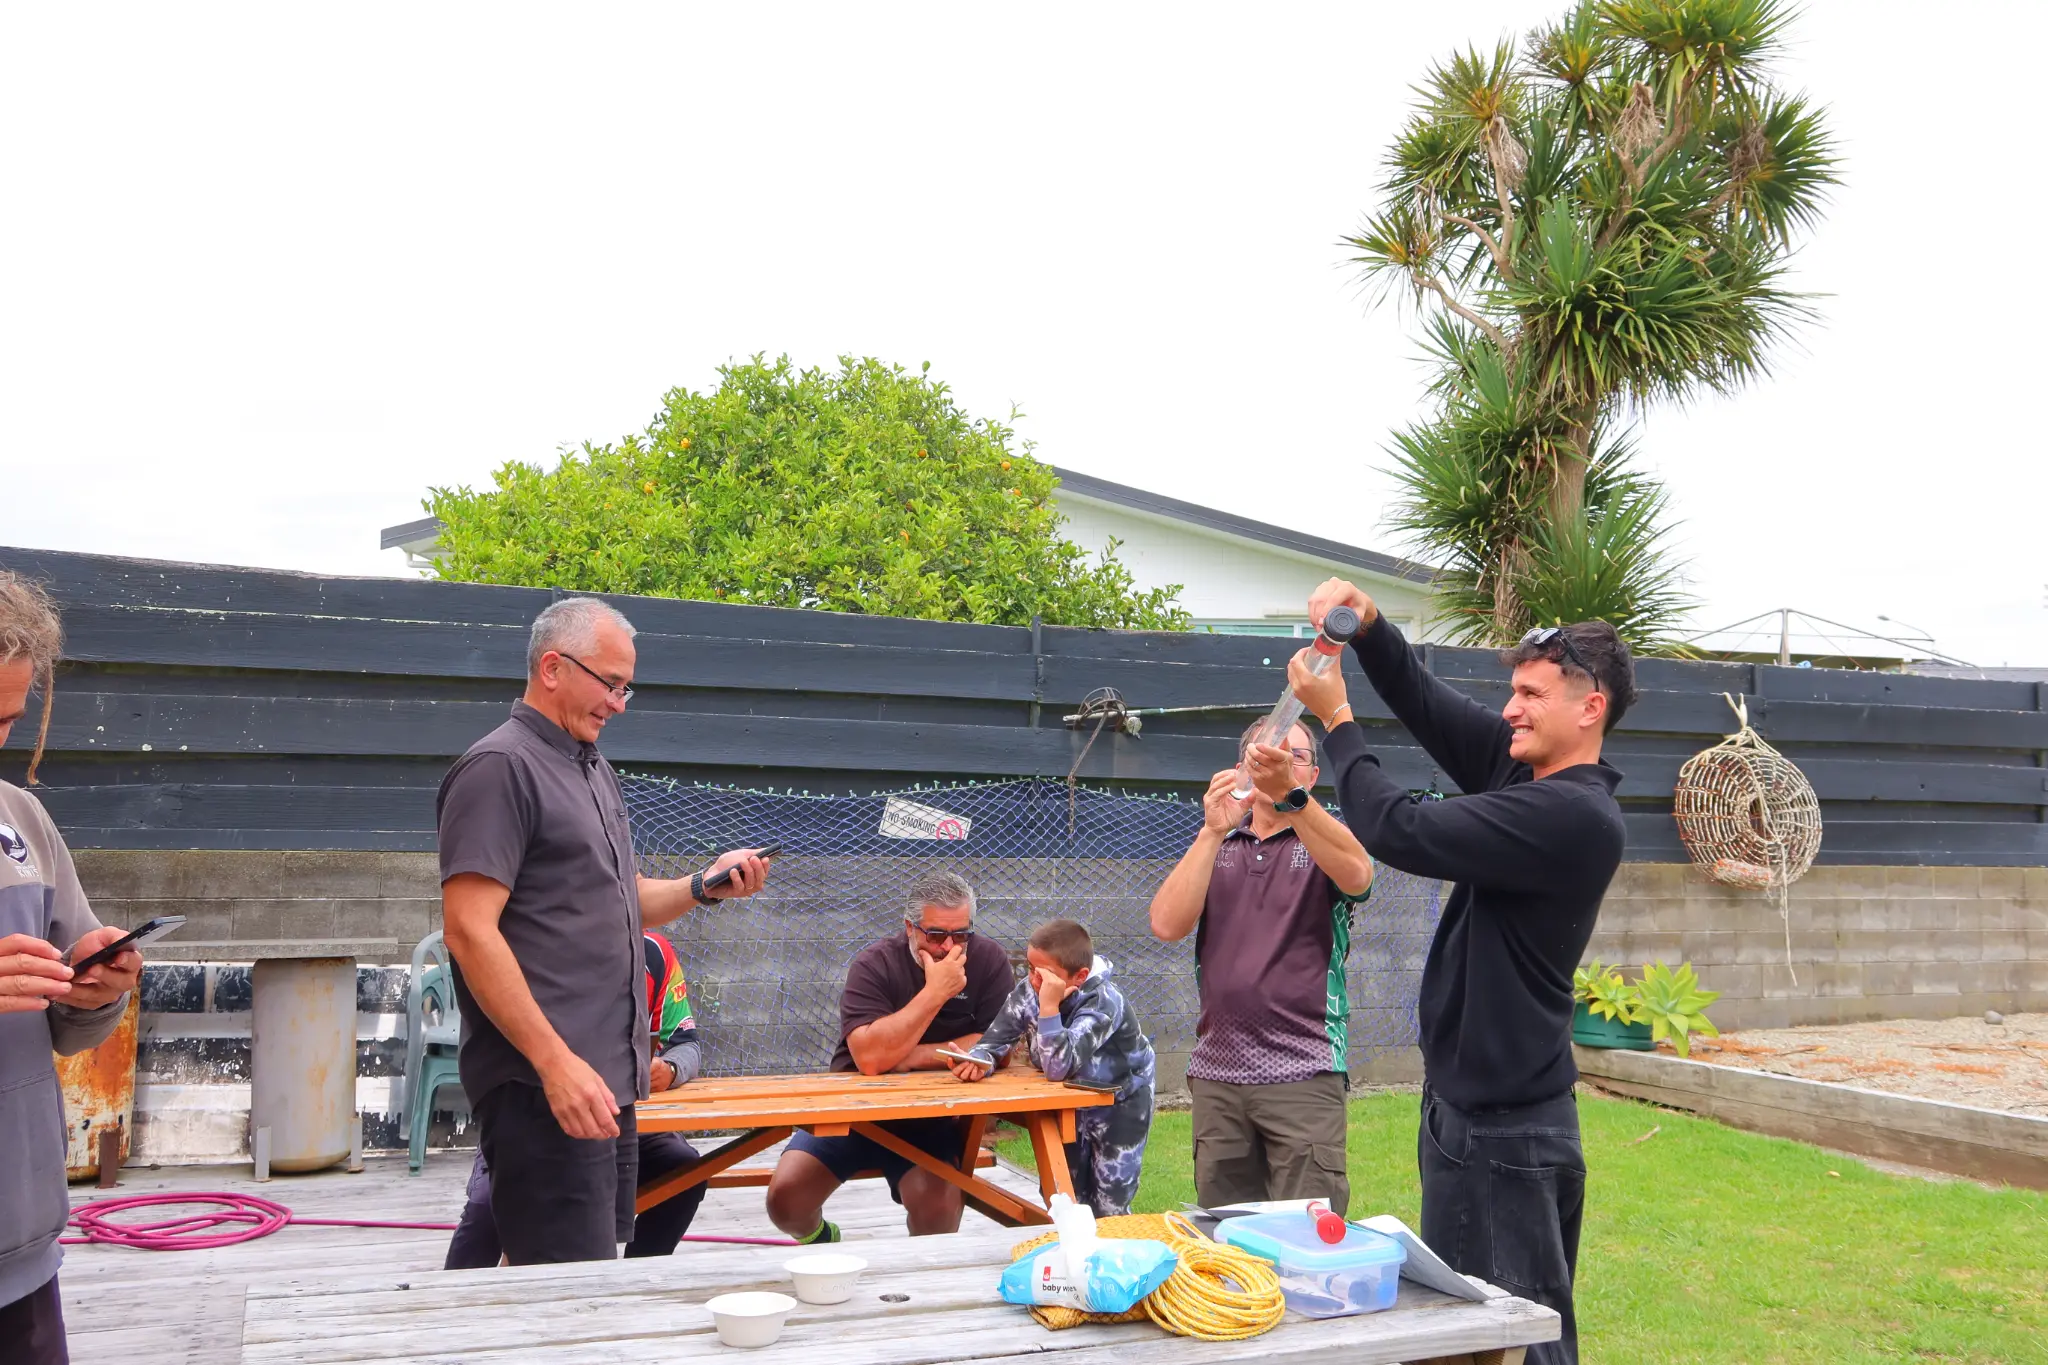
Water Clarity Testing
Wānanga training - visual clarity tube method
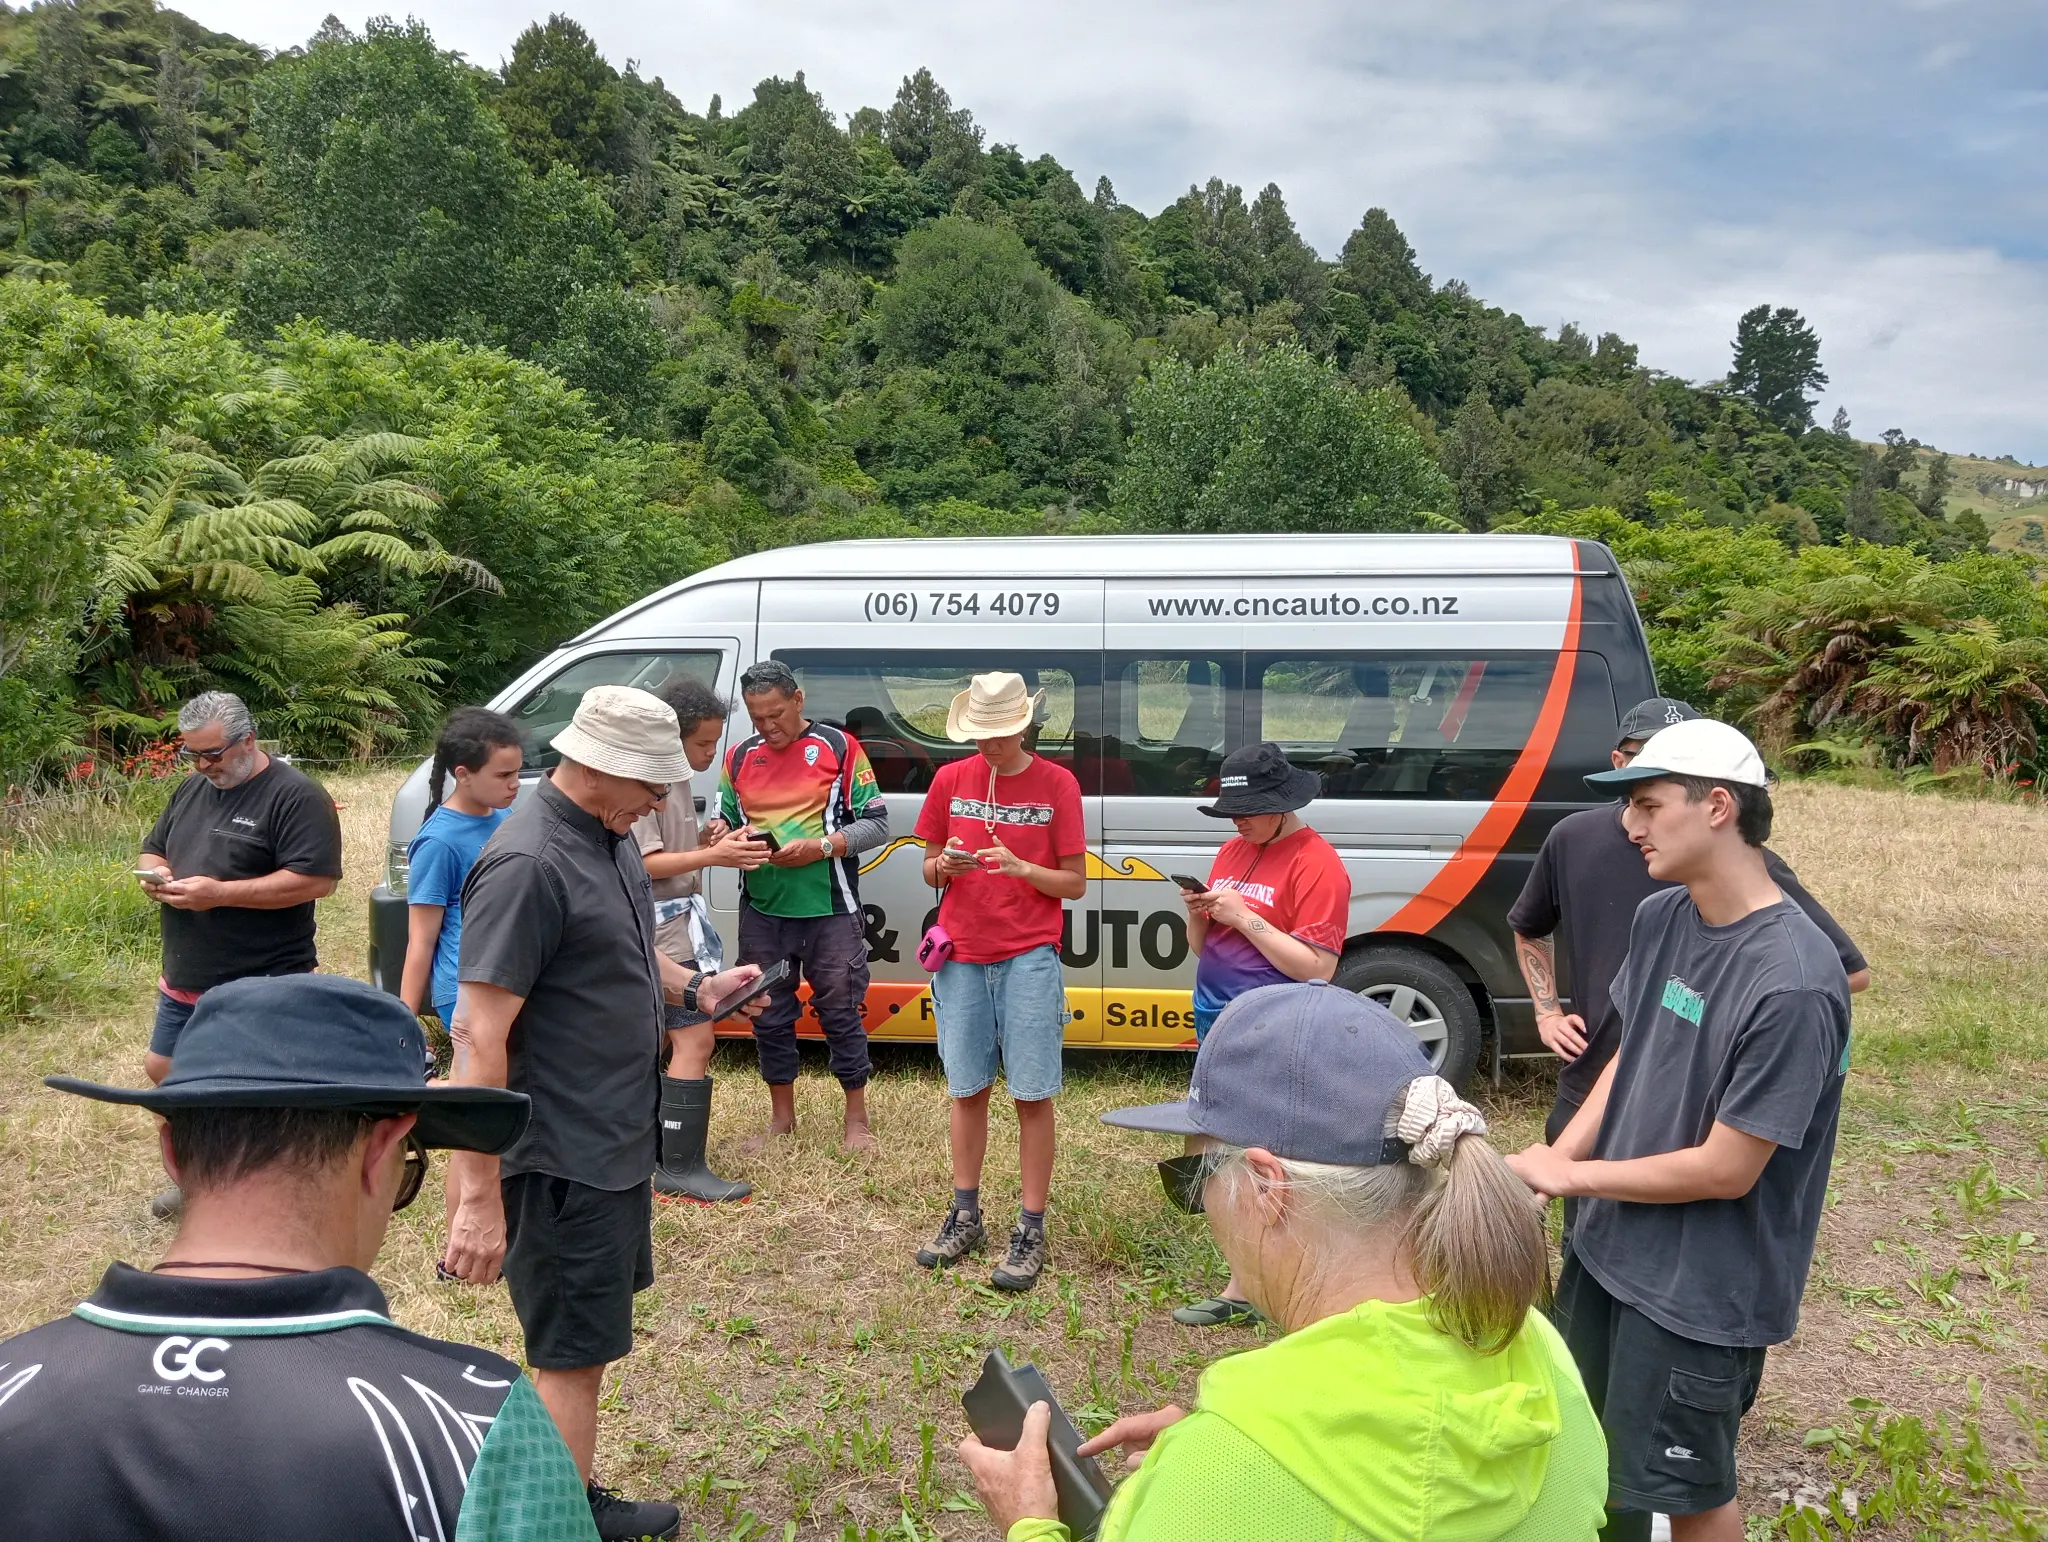
Site Briefing
Data recording app training in the field
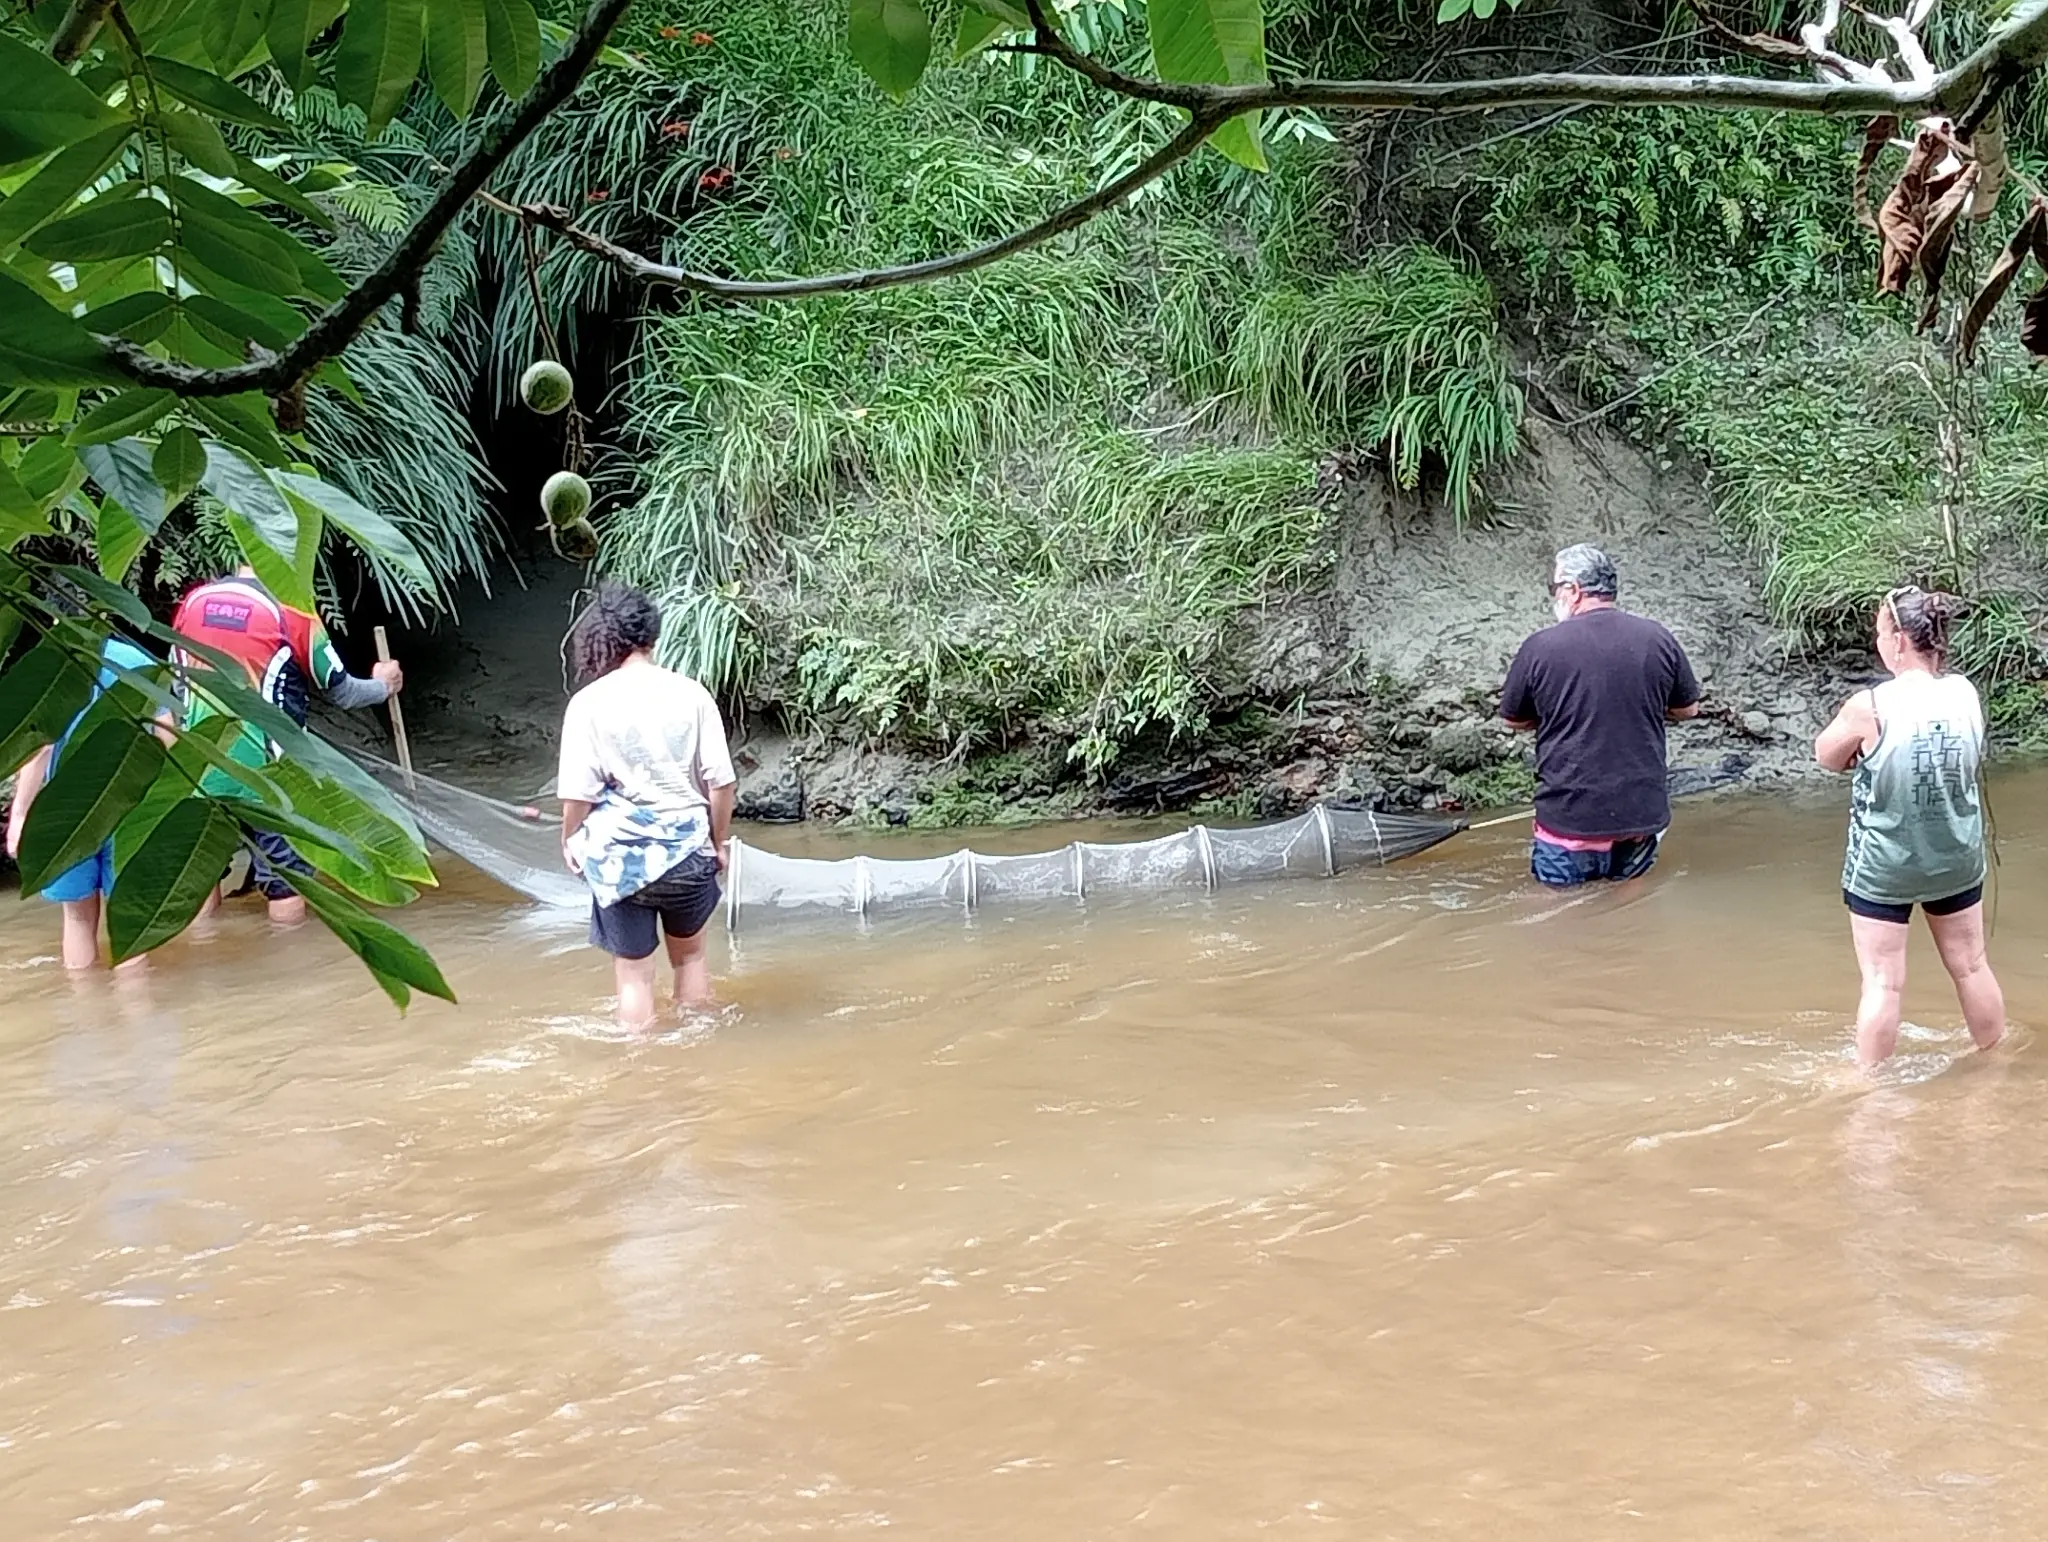
Seine Netting
Team working together in turbid water
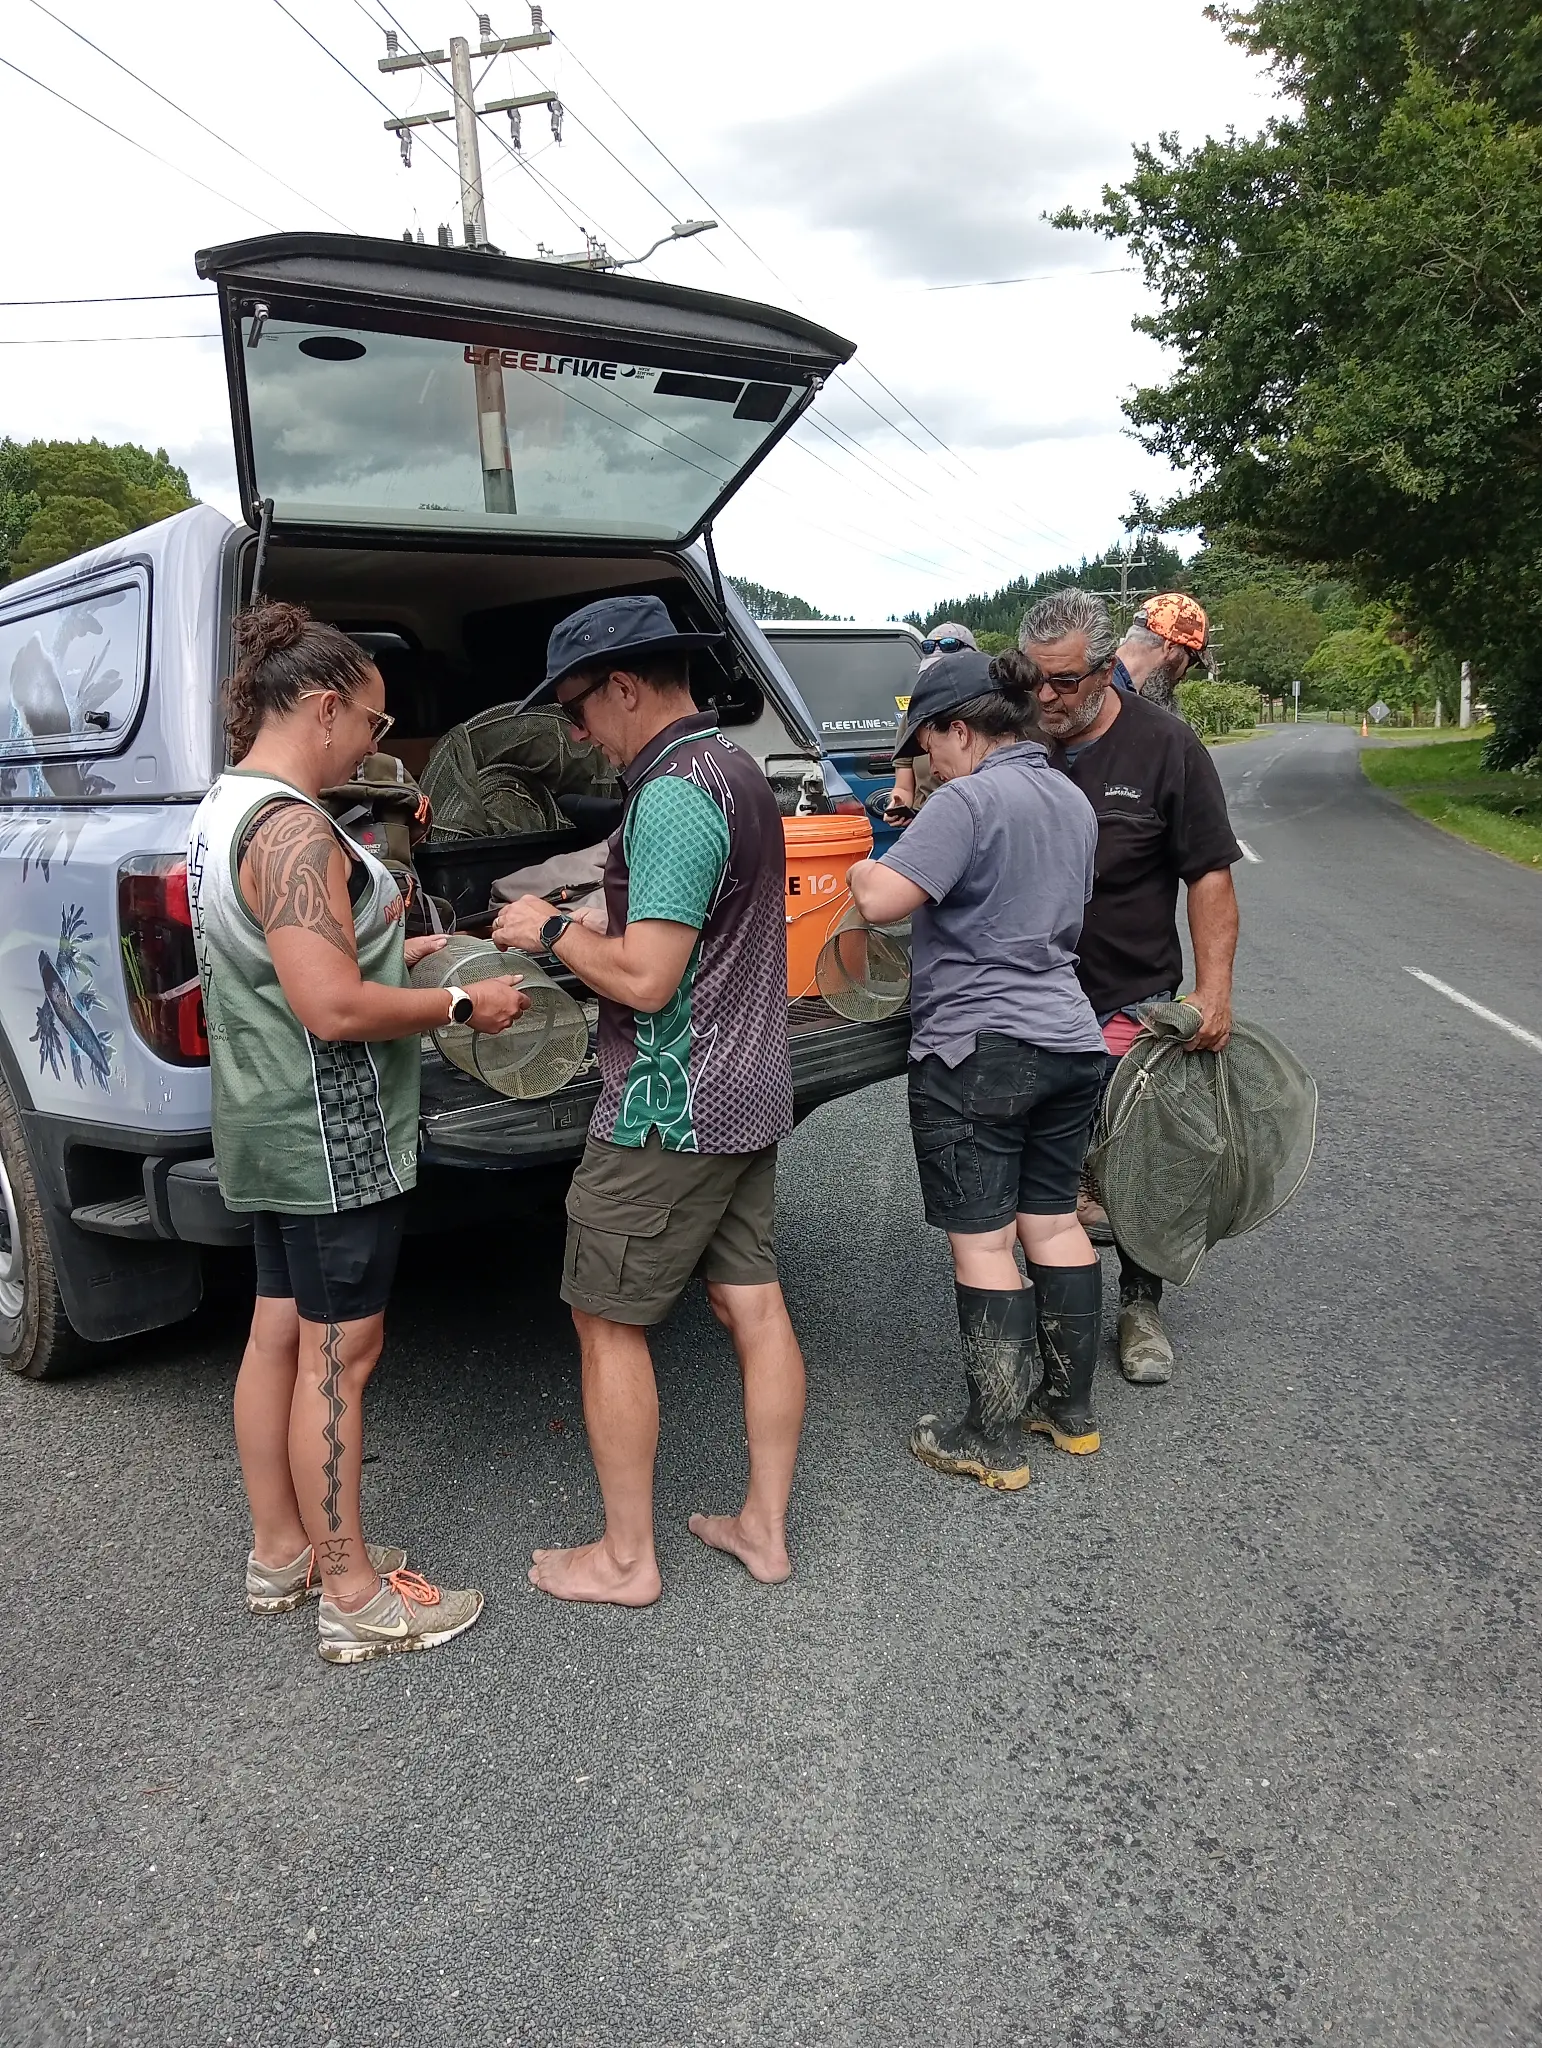
Gear Logistics
Loading fyke nets and equipment
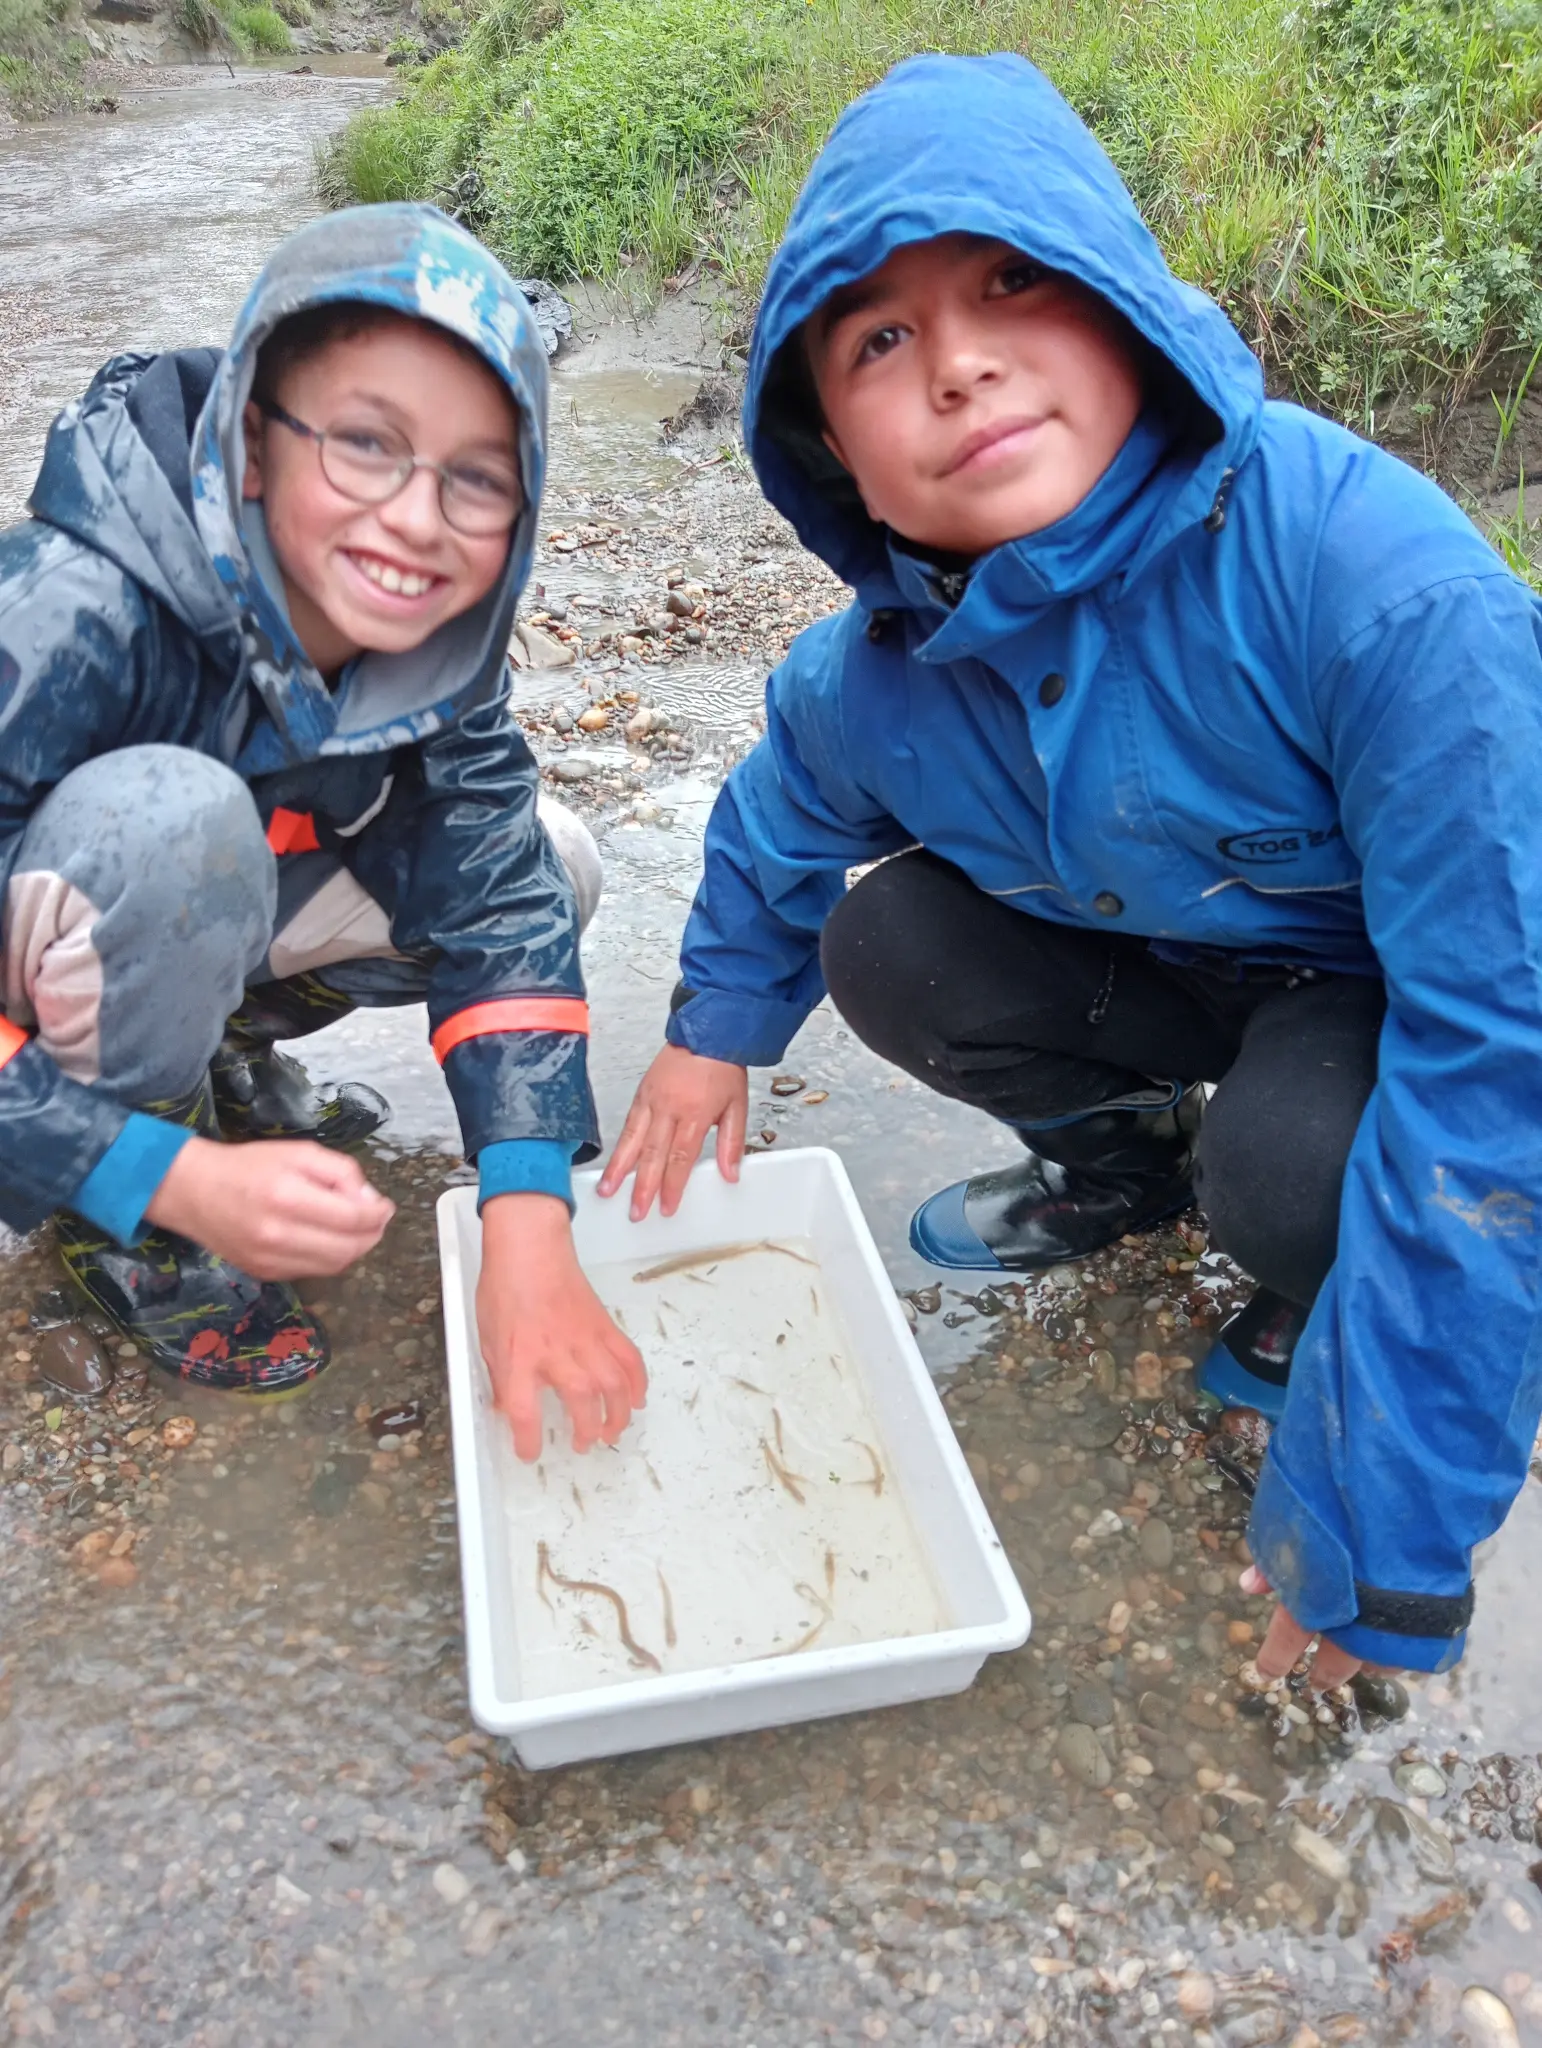
Rangatahi Discovery
Young scientists examining Īnanga catch - Day 2
Survey Team
Methodology Training
Team training session covering survey protocols, fish handling, and data recording procedures. 19 January 2026.

Team Assembly
Survey team assembled at Urenui Divers Club before deploying to field Biospheres. 19 January 2026.
Survey Methodology
Sampling Gear
- UNBAITED Fyke Nets (2 per site): Single-wing fyke nets deployed upstream and downstream to capture tuna and larger fish moving through the stream
- G-Minnow Traps: Unbaited traps targeting smaller species including juvenile fish, kōura (freshwater crayfish), and invertebrates
- Soak Time: Overnight deployment from late afternoon (4-6pm) to morning retrieval (8-10am), approximately 14-18 hours
Water Quality Monitoring
- Aqua TROLL 600: Multi-parameter sonde measuring pH, temperature, dissolved oxygen, conductivity, turbidity, and ORP
- Clarity Tube: Visual clarity assessment using standardised SHMAK black disc method
- VuSitu App: Real-time data logging and GPS tagging of all measurements
Fish Assessment
- Species ID: Visual identification of all native and introduced species
- Measurements: Total length (cm) using measuring board, weight (g) using digital scales
- Photo Documentation: Representative specimens photographed for verification
Environmental Context
- Lunar Phase: New Moon selected for optimal tuna activity (dark nights)
- Tidal Influence: Rising tide conditions recorded for coastal-connected Biospheres
- Weather: Temperature, rainfall (7-day antecedent), wind, and cloud cover
- Habitat Notes: Riparian vegetation, substrate type, and flow conditions
Assessment Framework
Data collected using the Mauri Compass framework, integrating mātauranga Māori with scientific monitoring. The Stream Health Monitoring and Assessment Kit (SHMAK) protocols ensure data quality and comparability with regional council monitoring programmes.